Article
citation information:
Taran,
I., Lytvyn, V., Muratbekova, G. Algorithm design for identifying rational parameters of
express bus service in urban settings. Scientific
Journal of Silesian University of Technology. Series Transport. 2025, 129, 237-259. ISSN: 0209-3324. DOI: https://doi.org/10.20858/sjsutst.2025.129.14
Ihor TARAN[1],
Vadym LYTVYN[2],
Gulzhan MURATBEKOVA[3]
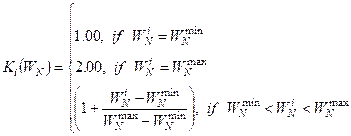
ALGORITHM DESIGN
FOR IDENTIFYING RATIONAL PARAMETERS OF EXPRESS BUS SERVICE IN URBAN SETTINGS
Summary. In modern urban
environments, the efficiency of public transportation systems plays a crucial
role in ensuring sustainable mobility and reducing traffic congestion. Among
various public transport services, bus systems remain the most flexible and
widely used mode of transit. However, growing travel demand and increasing road
traffic intensity often lead to delays, decreased service reliability, and
reduced passenger satisfaction. One effective solution to these challenges is
the implementation of express bus services, which offer limited-stop operations
aimed at reducing travel time and improving overall system efficiency. This
study focuses on the development of an algorithm for determining the rational
parameters of the express mode of bus traffic in urban areas. The proposed
approach considers factors such as passenger flow distribution, traffic
conditions, and operational constraints to identify optimal solutions that
enhance service performance and passenger convenience. The results are expected
to contribute to the improvement of urban public transport systems by providing
a methodological framework for efficient express service planning and
management.
Keywords: express mode, rational parameters, transport efficiency, quality of
service, bus route, number of stops
1.
INTRODUCTION
The expansion of economies around the world is
an unprecedented pace hand in hand with the process of urbanization. Based on
the UN data, it can be expected that by 2050 about 70% of the world population
will live within urban territories. This will create an additional burden on
the public transport system in the future. It is predicted that the number of
passengers transported within the cities will triple for the specified period.
The current stage in the development of passenger vehicles, due to the use of
intellectual transport systems (ITS), is characterized by the desire to achieve
the extremely high operational characteristics of the road transport vehicles,
the need to minimize the loss of time for transportation, and ensure the
comfort of passengers' trips. As it is known, one of the effective ways to
achieve the above tasks is to use buses on the city routes of the express mode
of bus traffic on city routes.
The express mode provides for bus stops only at
those points of the route that are characterized by the maximum passenger
turnover. A decrease in the number of bus stops helps to increase the bus’s
speed, reduce passenger’s travel time and improves vehicles capacity. The
development and implementation of ITS solutions for the express bus services
will help to improve the quality of services in public transport networks,
thereby increasing their attractiveness. Already now, ITS means playing an
important role in the urban environment, optimizing the work of transport, and
in combination with artificial intelligence (AI), they will influence the
formation of smart cities of the future. A continuous analysis of the collected
data, such as the number of passengers, makes virtual modelling of public
transport networks for years to come. A decrease in traffic jams and
environmental loads will ensure the growth of passenger flow and an increase in
carrier income.
The introduction of an express mode of buses
movement allows one to achieve significant technological and social effects
without the need for additional buses, and under certain conditions, even to
release part of the buses without deterioration of basic quality indicators of
transport service of passengers. Reducing the number of stops for express buses
helps to reduce fuel costs, increasing the profitability of transportation
while reducing of harmful emissions into the city's atmosphere [1].
Despite these advantages, the express mode was
not widely used in the first place due to the lack of a single methodology by
which its rational parameters can be determined.
2. LITERATURE
REVIEW AND PROBLEM STATEMENT
The successful operation of
express bus services requires the careful selection of operational parameters,
such as stop spacing, headways, and routing strategies. Determining rational
parameters for express modes involves balancing travel time savings for
through-passengers with accessibility needs for those boarding and alighting at
intermediate stops. Despite numerous studies on bus operation optimization,
there remains a need for comprehensive algorithms capable of adapting to
varying urban conditions and travel demand patterns.
In recent years, many studies have been presented in the scientific
literature on the optimization of various aspects of the express bus movement.
Below is a review of key works reflecting modern approaches and methods in this
area. Thus, in the papers [2, 3], methods of optimizing the number and location
of stops were considered in order to minimize the time in the path of
passengers. In studies [4, 5], approaches to determining the rational intervals
of movement and the functioning schemes of express routes in the conditions of
alternating passenger traffic and road situation were studied. Models were also
developed that take into account the features of the transport infrastructure,
the density of the development and the dynamics of the passenger flow throughout
the day [6, 7].
To optimize the bus schedule using deep training
Ai et al. [8] method of dynamic optimization of the bus schedule based on deep
learning with reinforcement (Deep Reinforced learning) was offered, which
allows adapting the intervals of movement in real time, depending on the
variable passenger flow. Oliveira et al. [9] developed framework for planning
the trajectories of autonomous buses, taking into account the characteristics
of the urban environment providing safe and efficient movement.
In the study [10],
conducted in the high-tech zone of the city of Zhengzhou, an improved algorithm
of an ant colony was proposed to optimize existing bus routes, taking into
account the features of urban development and passenger traffic. The same
algorithm for optimizing route networks of urban bus transport was used by
authors [11, 12]. Zhen and Gu [13] have developed models to optimize routes in
conditions of spatially heterogeneous demand, which is especially relevant for
rapidly developing urban areas. Models take into account variations in the
density of the passenger flow, providing an effective connection with the main
transport hubs.
The
authors [14] presented an asynchronous multiplayer approach to Deep Reinforced
learning to reduce the effect of “accumulations” of buses. The model optimizes
the strategy for holding buses at stops, given the uncertainty in passenger
traffic and road conditions. The study [15] offers the method of optimizing the
routes of express buses with a limited number of stops for long-distance
passengers. Using the algorithm for solving the routing problem taking into
account the landing and disembarkation of passengers, the authors achieve a
reduction in time on the way and increase the attractiveness of public
transport. A technical and operational assessment of the introduction of the
express mode of movement of buses on the city routes of Jizak
city (Uzbekistan) is presented in [16]. Wei and Zhu [17] considered the
optimization of bus routes in small and medium cities on the example of route
No 7 in the city of Jijoyzo. Methods of increasing
the efficiency and safety of the route are proposed, taking into account the
features of urban infrastructure and passenger flow.
Prediction
of passenger traffic is playing a key role in organizing express bus services.
Accurate forecasting enables optimization of intervals, the number of stops and
the schedule, providing a balanced ratio between the speed of transportation
and the availability of the route. Here you can highlight Baghbani et al. [18],
Bharathi et al. [19] and Shen et al. [20].
The
organization of dedicated lanes significantly increases the efficiency of bus
traffic in the conditions of city transport systems. Their implementation
reduces delays, increases the speed of routes, and helps to stabilize traffic
intervals, ensuring the priority of public transport in overloaded areas of the
road network. Studies by Khakimov et al. [21], Chen
et al. [22] and Jiang et al. [23] are devoted to the impact of the selected bus
lanes on the road traffic.
Separately, the cluster can be distinguished by
the control of the psychophysiological state of the driver [24]. Control is
necessary to ensure the safety of passenger transportation. Regular monitoring
enables timely identification of deviations that increase the risk of emergency
situations [25, 26].
And finally, the introduction of the express
operating mode of buses helps to reduce emissions of pollutants by reducing
travel time and the number of stops [27, 28]. This positively affects the
environmental situation in the city, reducing the level of air pollution in
areas with heavy traffic [29].
The analysis of the presented studies shows
that, despite the variety of approaches and methods, there is a need to develop
a complex algorithm that can take into account the dynamics of passenger flow,
the features of urban infrastructure, and operational restrictions. Such an
algorithm should provide adaptive and effective planning of express bus routes,
contributing to the improvement of the quality of service and sustainability of
the city transport system.
The purpose of the work is to develop an
algorithm for determining the rational parameters of the express mode of buses
in urban conditions. The rational parameters should be understood as the number
of buses on the route operating in express ![]() and conventional
and conventional ![]() (poster)
modes, as well as a list of stops a
(poster)
modes, as well as a list of stops a![]() t which express buses stop.
t which express buses stop.
3. METHODOLOGY
The following
initial data is required to determine the rational parameters of the express
movement of buses: the results of the passenger traffic survey (during which
the number of passengers that have entered ![]() and left
and left ![]() the vehicle at stops are determined); capacity
the vehicle at stops are determined); capacity
![]() , technical speed
, technical speed ![]() and bus movement interval
and bus movement interval ![]() ; duration of its
downtime at intermediate
; duration of its
downtime at intermediate ![]() and final stops
and final stops ![]() ; the distance
between the route stops
; the distance
between the route stops ![]() , the sum of which
is equal to its length
, the sum of which
is equal to its length ![]() .
.
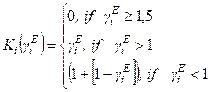
The authors offer
the following sequence of calculations.
1. Verification of
the expediency of introducing an express mode of traffic.
The paper [1] has
established the conditions for the expediency of the introduction of different
modes of movement of buses, which depend on the quantitative parameters of the
passenger traffic: ![]() , the coefficient of
variability of passengers and
, the coefficient of
variability of passengers and ![]() , the
coefficient of uneven passenger traffic on the route. It is proposed for these
indicators to use the appropriate standardized coefficients
, the
coefficient of uneven passenger traffic on the route. It is proposed for these
indicators to use the appropriate standardized coefficients ![]() and
and ![]() to establish the feasibility of organizing the
modes of traffic of buses on urban routes (Fig.1).
to establish the feasibility of organizing the
modes of traffic of buses on urban routes (Fig.1).
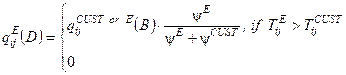
|
|
(1) |
where
![]() average passenger trip
length, km;
average passenger trip
length, km; ![]() and
and ![]() are medium and maximum
passenger traffic on the route, pass.
are medium and maximum
passenger traffic on the route, pass.
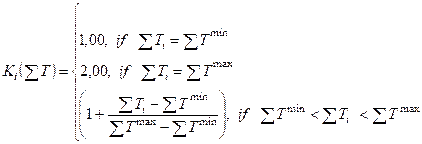
2. Determination of
the list of stops for the express route.
In express mode of
traffic, the buses do not stop at all stops, so it is advisable to submit
options for express route in the form of a logical vector, the elements of
which acquire a value of 1 or 0 (of course, that both final stops are
necessarily part of the express route, so ![]() ):
):
|
|
(2) |
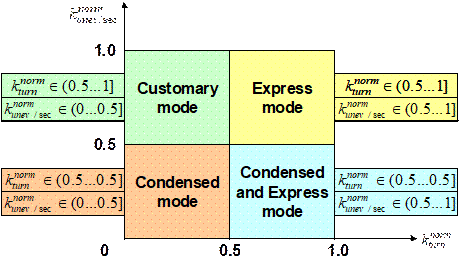
Fig. 1.
Conditions for the expediency of organizing modes of traffic on bus routes
where ![]() =1, if
=1, if ![]() -th bus stop is on the
express route;
-th bus stop is on the
express route; ![]() =0 – if
=0 – if ![]() -th bus stop is not on
the express route.
-th bus stop is not on
the express route.
As for the other stops {![]() …
…![]() }, the advantage should be given to stops that
are characterized by maximum passenger traffic
}, the advantage should be given to stops that
are characterized by maximum passenger traffic ![]() . To quantify the list of stops that are part of
the express route, an empirical condition for exclusion from the express route
at
. To quantify the list of stops that are part of
the express route, an empirical condition for exclusion from the express route
at ![]() -th stop of the usual
route should be used:
-th stop of the usual
route should be used:
|
|
(3) |

where ![]() is the
number of passengers who do not use
is the
number of passengers who do not use ![]() -th stop (4);
-th stop (4); ![]() is the
number of passengers who use
is the
number of passengers who use ![]() -th stop (5);
-th stop (5); ![]() is bus
movement interval, in normal motion mode.
is bus
movement interval, in normal motion mode.
|
|
(4) |
where
![]() is the level filling
the buses between
is the level filling
the buses between ![]() and
and ![]() -th stops.
-th stops.
|
|
(5) |
Considering
that during the day the bus interval changes in the range from ![]() the
morning "peak" to 2
the
morning "peak" to 2![]() in the
interpeak period, an extended method is offered to identify vector variants
in the
interpeak period, an extended method is offered to identify vector variants ![]() :
:
|
|
(6) |


This
approach to increasing the number of stops for ![]() and
and ![]() slightly
offsets the efficiency of the express mode (due to the increase in the number
of stops) but increases the potential number of passengers that can use it. It
also takes into account the change in buses route intervals during the day and
thus allows you to get such combinations
slightly
offsets the efficiency of the express mode (due to the increase in the number
of stops) but increases the potential number of passengers that can use it. It
also takes into account the change in buses route intervals during the day and
thus allows you to get such combinations ![]() that will
allow to organize the most effective options for express mode, both for
passengers and for transport enterprises. The final decision on the efficiency
of implementation of one or another variant
that will
allow to organize the most effective options for express mode, both for
passengers and for transport enterprises. The final decision on the efficiency
of implementation of one or another variant ![]() can only
be obtained by modeling results.
can only
be obtained by modeling results.
3.
Restoration of the matrix of interstops
correspondence.
One
of the main data for calculating the technical and operational indicators of
buses on the route with express mode is the matrix of interstops
correspondence of passengers ![]() . Usually, its elements are determined by the
coupon or questionnaire methods of examination of passenger traffic. But these
methods are characterized by the high complexity of procedures and primary
materials processing. Therefore, the restoration of the matrix of interstops correspondence is proposed to be performed with
the help of the calculation and analytical method, which allows for the
probabilistic ratios of information about the number of passengers who have
entered and left the vehicle at the route stops to calculate
. Usually, its elements are determined by the
coupon or questionnaire methods of examination of passenger traffic. But these
methods are characterized by the high complexity of procedures and primary
materials processing. Therefore, the restoration of the matrix of interstops correspondence is proposed to be performed with
the help of the calculation and analytical method, which allows for the
probabilistic ratios of information about the number of passengers who have
entered and left the vehicle at the route stops to calculate ![]() components (with a maximum error of 5…7%)
according to the following ratios:
components (with a maximum error of 5…7%)
according to the following ratios:
|
|
(7) |

where ![]() is the
number of passengers who entered the bus at the
is the
number of passengers who entered the bus at the ![]() -th stop point and
left it on
-th stop point and
left it on ![]() -th and the following
stops:
-th and the following
stops:
|
|
(8) |

where ![]() is number
of passengers who entered the bus at
is number
of passengers who entered the bus at ![]() -th stop.
-th stop.
4. Redistribution of passengers on the route
between modes of traffic and calculation of technical and operational
indicators of buses.
In [1], the authors offered as the main criteria
for evaluating the efficiency of the introduction of an express mode to use the
difference between potential and actual transport works performed by buses on
the route ![]() and the total time of passenger on travel and
waiting at stops:
and the total time of passenger on travel and
waiting at stops: ![]() . The decrease
. The decrease ![]() leads to an increase in the dynamic coefficient of
use of vehicles and reducing the cost of transportation. The reduction
leads to an increase in the dynamic coefficient of
use of vehicles and reducing the cost of transportation. The reduction ![]() helps to increase the quality of passenger service
and reduce transport fatigue.
helps to increase the quality of passenger service
and reduce transport fatigue.
For the calculation ![]() and
and ![]() we used elements of the matrix of interstop
correspondence
we used elements of the matrix of interstop
correspondence ![]() . But they require constant
redistribution between motion modes depending on the list of stops that are
part of the express route
. But they require constant
redistribution between motion modes depending on the list of stops that are
part of the express route ![]() and the number of buses operated in normal
and the number of buses operated in normal ![]() and express
and express ![]() modes. The procedure of
such redistribution was developed by the authors on the basis of formalization
of time spent time in express
modes. The procedure of
such redistribution was developed by the authors on the basis of formalization
of time spent time in express ![]() and normal modes
and normal modes ![]() [1] and represented by calculation
dependencies (9-13).
[1] and represented by calculation
dependencies (9-13).
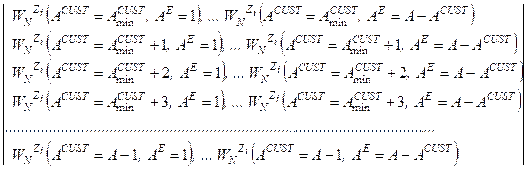
|
|
(9) |

|
|
(10) |

|
|
(11) |

|
|
(12) |
|
|
(13) |

where ![]() ,
, ![]() are the
number of bus trips within an hour in express and normal modes, respectively
are the
number of bus trips within an hour in express and normal modes, respectively
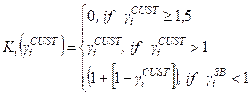
Thus, the volume of transportation will be
distributed between motion modes as follows: ![]() and
and ![]() (Fig. 2).
A closer look should be taken at the structure of the calculation
(Fig. 2).
A closer look should be taken at the structure of the calculation![]() ,
, ![]() , components (11-13) and other technical and
operational indicators of buses operating in a combined mode with express and
conventional modes. Passengers' time spent in express
, components (11-13) and other technical and
operational indicators of buses operating in a combined mode with express and
conventional modes. Passengers' time spent in express ![]() or normal
or normal
![]() modes
when travelling between
modes
when travelling between ![]() -th and
-th and ![]() -th stop points
consist of a time of travel (
-th stop points
consist of a time of travel (![]() or
or ![]() ) and the cost of waiting for buses (
) and the cost of waiting for buses (![]() or
or ![]() ) at stops and calculated by the following
dependencies:
) at stops and calculated by the following
dependencies:
|
|
(14) |
where ![]() ,
, ![]() are buses intervals
operating in express and normal modes, respectively, min.
are buses intervals
operating in express and normal modes, respectively, min.
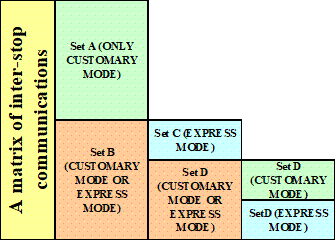
Fig. 2. Distribution A matrix of interstop communications between bus modes
The time for bus travel (![]() ,
,![]() ) in the appropriate mode consists of the time
of traffic of buses
) in the appropriate mode consists of the time
of traffic of buses ![]() between
between ![]() -th and
-th and ![]() -th stops and cost of
downtime at the intermediate route stops:
-th stops and cost of
downtime at the intermediate route stops:
|
|
(15) |

|
|
(16) |
where ![]() ,
, ![]() are the
number of intermediate bus stops on the path between
are the
number of intermediate bus stops on the path between ![]() -th and
-th and ![]() -th stop points for
buses operating in express and normal modes, respectively.
-th stop points for
buses operating in express and normal modes, respectively.
The
time of movement of buses between ![]() -th and
-th and ![]() -th stop points is,
min.:
-th stop points is,
min.:
|
|
(17) |
where ![]() – the
distance between
– the
distance between ![]() -th and
-th and ![]() -th stop points, km:
-th stop points, km:
|
|
(18) |
To
calculate the components of the matrices (17) and (18) buses intervals ![]() and
and ![]() determine
by the following dependencies:
determine
by the following dependencies:
|
|
(19) |
where ![]() ,
, ![]() are the
duration of buses turnover that operate in express and normal modes
respectively, min:
are the
duration of buses turnover that operate in express and normal modes
respectively, min:
|
|
(20) |

|
|
(21) |

where ![]() ,
, ![]() are the
lists of stop points belonging to the express and normal route, respectively,
min.
are the
lists of stop points belonging to the express and normal route, respectively,
min.
Number of trips performed by buses within an
hour in express and normal modes, respectively:
|
|
(22) |
The total potential transport work performed by
buses on the route and by appropriate modes of movement:
|
|
(23) |
The total actual transport work performed by
buses on the route and according to the appropriate modes of transportation:
|
|
(24) |
|
|
(25) |
|
|
(26) |
The difference between the potential and actual
transport work performed by buses on the route during the billing period:
|
|
(27) |
Bus capacity coefficients operating in normal
and express motion modes:
|
|
(28) |


Total passengers' time spent on traveling using
normal mode in the following directions (![]() →
→![]() )
)![]() :
:
|
|
(29) |

Total passengers' time spent on traveling using
the express mode in the following directions (![]() →
→![]() )
)![]() :
:
|
|
(30) |

Total passengers' time spent on traveling using
the normal mode in the following directions (![]() →
→![]() )
)![]() :
:
|
|
(31) |

Total passengers' time spent on traveling using
the express mode in the following directions (![]() →
→![]() )
)![]() :
:
|
|
(32) |

In expressions (31) and (32) passengers' time
spent waiting is calculated on the basis of the value of the average movement
interval for both modes ![]() :
:
|
|
(33) |
Total passengers' time spend traveling on the
route:
|
|
(34) |
5. A procedure for finding rational parameters.
Considering the fact that not all passenger
correspondence can be serviced by the express mode, it is advisable to
introduce a combined mode that combines both modes: the express and normal.
The
essence of the method of determining the rational parameters of such a mode
lies in the mathematical modelling of the process of transportation on the
route, which calculates the components of models (27-28) and (34) for (6)
combinations of stops of express route and the number of buses operating in
normal ![]() and express
and express ![]() modes. In
the future, on the basis of the formed criterion, such parameters of route
work, which are characterized by the maximum efficiency and quality of
transportation, are selected.
modes. In
the future, on the basis of the formed criterion, such parameters of route
work, which are characterized by the maximum efficiency and quality of
transportation, are selected.
According
to the restriction on the maximum permissible interval of conventional buses
(35), the modeling must be carried out for several
data groups (36).
|
|
(35) |
where ![]() is the
minimum allowable number of buses operating in the normal mode, provided that
the maximum permissible movement interval
is the
minimum allowable number of buses operating in the normal mode, provided that
the maximum permissible movement interval ![]() is not
exceeded (in urban conditions it should not exceed 15… 20 minutes).
is not
exceeded (in urban conditions it should not exceed 15… 20 minutes).
|
|
(36) |

By
changing the combination of stops on the express route ![]() and the
number of buses operating in normal
and the
number of buses operating in normal ![]() and
express
and
express ![]() modes,
one can obtain the set of values
modes,
one can obtain the set of values ![]() that was
chosen as the main criterion for transportation efficiency:
that was
chosen as the main criterion for transportation efficiency:
|
|
(37) |
The results obtained allow us to determine the
area of acceptable values ![]() . It should be noted that the function
. It should be noted that the function ![]() is
discrete in nature, since the number
is
discrete in nature, since the number ![]() and
and ![]() are the
whole values. From above, this area is limited to the level that determines the
option of organizing transportation on the route using only the usual mode of
traffic. Exceeding this limit, in terms of the selected performance criterion
are the
whole values. From above, this area is limited to the level that determines the
option of organizing transportation on the route using only the usual mode of
traffic. Exceeding this limit, in terms of the selected performance criterion ![]() when organizing express mode on
the route is inappropriate. The bottom is limited to the level
when organizing express mode on
the route is inappropriate. The bottom is limited to the level ![]() , as with negative value
, as with negative value ![]() s, the potential transport work on the route is
less than the actual one. The implementation of such options for express
traffic will worsen the quality of the transport service due to the increase in
the coefficients of use of bus capacity beyond normalized values. In the
future, one option will be selected from the plural
s, the potential transport work on the route is
less than the actual one. The implementation of such options for express
traffic will worsen the quality of the transport service due to the increase in
the coefficients of use of bus capacity beyond normalized values. In the
future, one option will be selected from the plural ![]() under conditions
under conditions ![]() and
and ![]() for further research only one variant is
selected, which provides
for further research only one variant is
selected, which provides ![]() at
at ![]() .
.
It should be noted that the reduction ![]() can be
achieved in various variants of the organization of the express mode, including
those that are unacceptable, both in terms of the quality of transport service
of passengers and in view of economic feasibility for transport enterprises. In
practice, it is almost impossible fill the busses with on the route with
fullness the buses
can be
achieved in various variants of the organization of the express mode, including
those that are unacceptable, both in terms of the quality of transport service
of passengers and in view of economic feasibility for transport enterprises. In
practice, it is almost impossible fill the busses with on the route with
fullness the buses ![]() , and a significant difference in the operating
conditions of the modes will lead to uneven provision of transport services and
the cost-effectiveness of transportation. For a comprehensive assessment of the
obtained
, and a significant difference in the operating
conditions of the modes will lead to uneven provision of transport services and
the cost-effectiveness of transportation. For a comprehensive assessment of the
obtained ![]() -th variants of the
combined mode with express mode the authors in [1] proposed to use a criterion
that additionally takes into account the quality of transportation:
-th variants of the
combined mode with express mode the authors in [1] proposed to use a criterion
that additionally takes into account the quality of transportation: ![]() ;
; ![]() ;
; ![]() ; and an additional economic effect that will be
observed in case of minimal difference in the conditions of operation of both
modes and the desire of coefficients of use of bus capacity to
; and an additional economic effect that will be
observed in case of minimal difference in the conditions of operation of both
modes and the desire of coefficients of use of bus capacity to ![]() and
and ![]() :
:
|
|
(38) |

where ![]() is an
indicator that takes into account the decrease
is an
indicator that takes into account the decrease ![]() ;
; ![]() is an
indicator that takes into account the fullness of buses;
is an
indicator that takes into account the fullness of buses; ![]() is an
indicator that takes into account the reduction of the total time spent by
passenger for movement.
is an
indicator that takes into account the reduction of the total time spent by
passenger for movement.
The structure of the complex criterion (38) is
given on (39-42):
|
|
(39) |
|
|
|
(40) |
|
|
|
(41) |
|

|
|
(42) |
The use of the proposed complex criterion (38)
enables the determination of rational parameters for express traffic on city
bus routes, which ensure the improvement of the efficiency of vehicles and the
quality of passenger service.
Summarizing the results of the study, the
authors developed an algorithm for determining the rational parameters of the
express buses in urban conditions, which is given in Fig. 3.
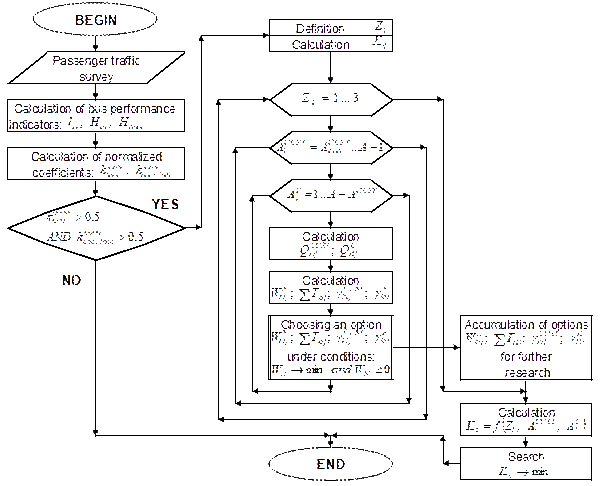
Fig. 3. Algorithm for determining rational
parameters of express mode of
bus movement in urban terms
4. RESULTS AND
DISCUSSION
The testing of the
developed algorithm for determining the rational parameters of the express bus
movement was carried out in the conditions of Dnipro. City route No. 155
(Topolia-3-Vokzalna Square) was selected as the object of study. The route
operates 25 buses BАZ A81
for ![]() passengers
in normal mode. The main characteristics of route No. 155 are shown in Table 1.
passengers
in normal mode. The main characteristics of route No. 155 are shown in Table 1.
Tab. 1
The main characteristics of route No. 155
|
Indicator |
value |
|
The
length of the route |
20.4 |
|
The
duration of bus turnover |
126 |
|
Technical
speed |
19.4 |
|
Number
of stops on the route |
27 |
|
Bus
movement interval (morning "peak"), min |
5 |
|
The
capacity provided on the route |
552 |
The
survey of passenger traffic on route No. 155 was conducted using the
tabular method in the morning "peak" in the direct (most loaded)
direction of Topolia-3 → Vokzalna Square.
Figure 4 shows a compatible analysis of passenger traffic flaws by route ![]() and passenger exchange at stop
points
and passenger exchange at stop
points ![]() ,
which shows that the capacity provided on the route
,
which shows that the capacity provided on the route ![]() is sufficient for the
assimilation of passenger traffic on the most loaded section of the route
is sufficient for the
assimilation of passenger traffic on the most loaded section of the route ![]() , and
the passenger exchange of stop points is characterized by significant unevenness.
, and
the passenger exchange of stop points is characterized by significant unevenness.
|
|
Fig. 4. Compatible analysis of passenger traffic
and passenger exchange at stop points
On the other hand, the release of a route of
such a number of buses that provides maximum passenger traffic only on the
loaded route only, leads to their lack of use in other route parts, which leads
to a decrease in the coefficient of use of bus capacity, and therefore
increases the cost of transportation.
The
structure of distribution of transport work on the route is shown in Figure 5,
the analysis of which shows that the vast majority of the route parts have a
share of unproductive transport work ![]() (27) ranging from 10 to 70%. In general, on
the route, potential transport work (23) is
(27) ranging from 10 to 70%. In general, on
the route, potential transport work (23) is ![]() pass.∙km, and
the actual is
pass.∙km, and
the actual is ![]() pass.∙km
(according to the survey). Thus,
pass.∙km
(according to the survey). Thus, ![]() which is 23% of
which is 23% of ![]() . This
situation significantly reduces the efficiency of transportation.
. This
situation significantly reduces the efficiency of transportation.
|
|
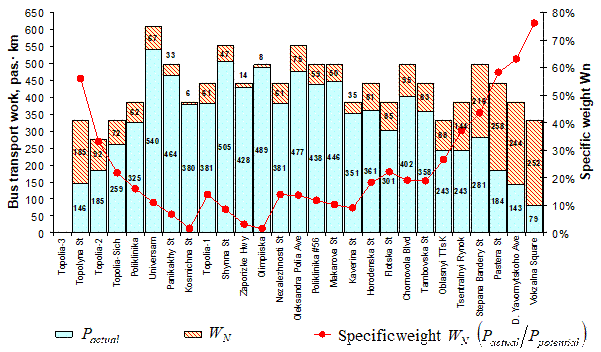
Fig. 5. Structure of distribution of transport
work on route №155
However, reducing the number of buses on the
route will result in vehicles being more than fully loaded and even refusing
passengers, which will reduce the quality of the transportation service. Thus,
there is a need to introduce a combined mode of transportation with express
service on route No. 155,
which will release part of the vehicles (by increasing their capacity) and
reduce the total cost of passengers on the trip (by increasing the speed of bus
connection).
Also, according
to the results of the survey, it was found that: the value of the maximum
passenger traffic on the route is ![]() pass; medium passenger traffic is
pass; medium passenger traffic is ![]() pass; the average length of passenger trip
pass; the average length of passenger trip ![]() km; passengers' variance ratio
km; passengers' variance ratio ![]() . The values calculated for
(1-2) normalized varieties
. The values calculated for
(1-2) normalized varieties ![]() and uneven passenger traffic on the route
and uneven passenger traffic on the route ![]() (which determine the conditions of
organization of the relevant modes of traffic on bus routes) are 0.52 and 0.77,
respectively, which confirms the feasibility of introducing of the combined
mode with the express mode on the route No. 155 (fig. 1).
(which determine the conditions of
organization of the relevant modes of traffic on bus routes) are 0.52 and 0.77,
respectively, which confirms the feasibility of introducing of the combined
mode with the express mode on the route No. 155 (fig. 1).
On the basis of the conditions (6), three
options for the express route consisting of ![]() ,
, ![]() , and
, and ![]() stops
were formed:
stops
were formed:
·
 – 8 stop points:
1→2→3→12→14→24→26→27;
·
 – 13 stop points:
1→2→3→8→12→14→18→22→24→23→25→26→27;
·
 – 16 stop points:
1→2→3→4→8→12→14→17→18→21→22→24→23→25→26→27.
Since the working trip duration on the route is ![]() minutes,
and the maximum permissible interval of buses in urban conditions is
minutes,
and the maximum permissible interval of buses in urban conditions is ![]() minutes,
for (35)
minutes,
for (35) ![]() buses.
Mathematical modeling of the process of
transportation for (9-34) was performed under the conditions (36) for
buses.
Mathematical modeling of the process of
transportation for (9-34) was performed under the conditions (36) for![]() ,
, ![]() and
and ![]() stops. Selected for further research options,
which provide
stops. Selected for further research options,
which provide ![]() at
at ![]() under conditions
under conditions ![]() and
and ![]() are shown in figures (6-8). Figure 9
shows a compatible analysis of the distribution of the number of passengers
transported (according to modes) and the total passengers' time spent on the
trip.
are shown in figures (6-8). Figure 9
shows a compatible analysis of the distribution of the number of passengers
transported (according to modes) and the total passengers' time spent on the
trip.
|
|
|
|
|
|
|
Fig. 6. A
compatible distribution analysis |
|
|
|
|
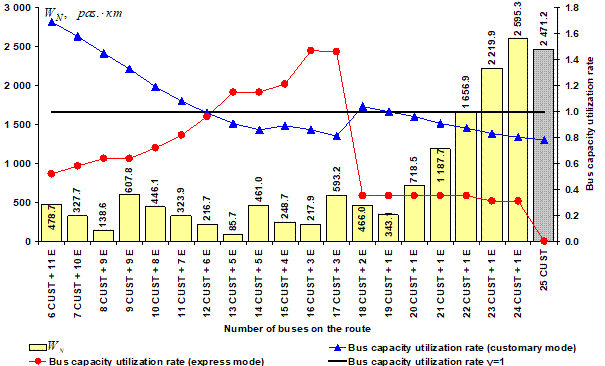
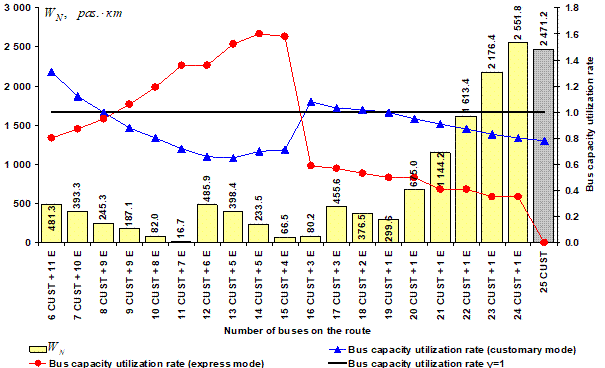
Fig. 7. A compatible
distribution analysis ![]() ,
, ![]() and
and ![]() for
for ![]()
|
|
|
|
|
Fig. 8. A
compatible distribution analysis |
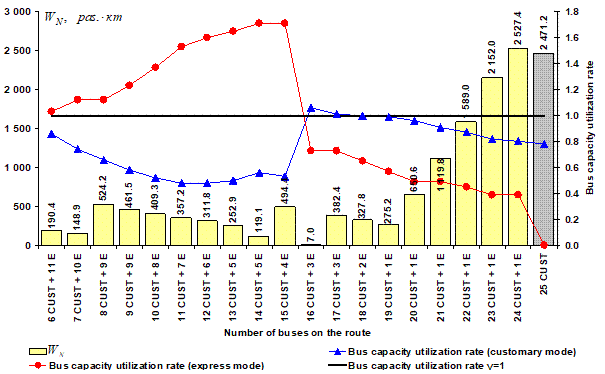
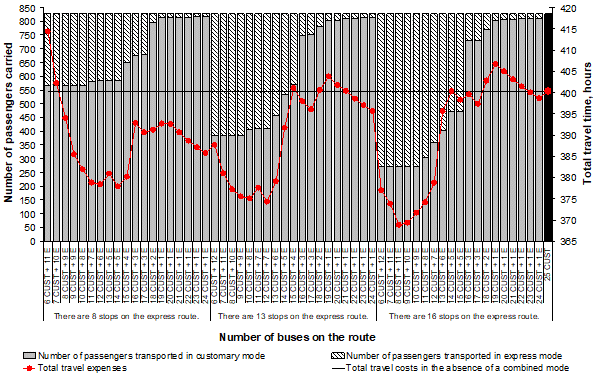
Fig. 9. A
compatible analysis of the distribution of the number of passengers transported
(according to motion modes) and the total time spent moving.
Analysis of figures (6-9) allows one to draw the
following conclusions:
·
increasing the number of stops on an express
route leads to an increase in the number of passengers using it: ![]() pass,
pass, ![]() pass,
pass, ![]() pass., which is 32%, 53% and 67% of the total
number of passengers, respectively;
pass., which is 32%, 53% and 67% of the total
number of passengers, respectively;
·
for the vast majority of ratios ![]() and
and ![]() there is
a reduction in the total travel time by an average of 10%;
there is
a reduction in the total travel time by an average of 10%;
·
operation of fewer than 3…4 express buses leads
to passengers refusing the express service due to a significant increase in
waiting time.
The results of the calculations of the complex
criterion ![]() for (38)
are shown in Figure 10, indicating that the maximum efficiency of the passenger
transportation process on route No. 155 can be achieved with the following two
combined mode variants:
for (38)
are shown in Figure 10, indicating that the maximum efficiency of the passenger
transportation process on route No. 155 can be achieved with the following two
combined mode variants: ![]() and
and ![]() . These variants will release 28% of vehicles,
reduce
. These variants will release 28% of vehicles,
reduce ![]() by 89%, reduce the total expenses of passengers
for movement by 6%, increase the speed of connection and the coefficient of bus
capacity usage by 15% and 24%, respectively. A comprehensive assessment of the
parameters of the express mode of movement of buses on route No. 155 from the standpoint of
technological transportation efficiency is given in Table 2. The analysis of
the information, which is given in Table 2, shows that both of the proposed
options allow for a significant improvement of the efficiency of the
transportation process on route No.
155.
by 89%, reduce the total expenses of passengers
for movement by 6%, increase the speed of connection and the coefficient of bus
capacity usage by 15% and 24%, respectively. A comprehensive assessment of the
parameters of the express mode of movement of buses on route No. 155 from the standpoint of
technological transportation efficiency is given in Table 2. The analysis of
the information, which is given in Table 2, shows that both of the proposed
options allow for a significant improvement of the efficiency of the
transportation process on route No.
155.
Given that the combined modes under study are
formed by a combination of normal and express modes, the general technical and
operational indicators for buses ![]() were
calculated as average weighted values according to the number of ordinary and
express trips:
were
calculated as average weighted values according to the number of ordinary and
express trips:
|
|
(43) |
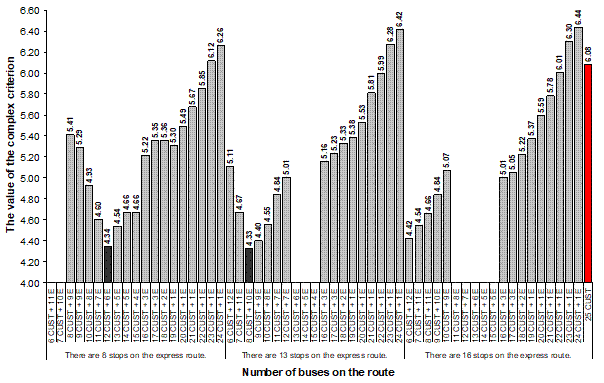
Fig. 10. Results of calculations of a complex criterion ![]()
However, it should be noted that releasing of
part of the buses on route No. 150 will lead to certain but insignificant,
negative phenomena. Prior to the implementation of combined modes, the traffic
interval on the route was 5 minutes, and after – 6 minutes, which can be
considered acceptable and typical for most city bus routes. Also, in some route
parts, there will be an exceeding of the rated bus capacity (mainly on the
normal mode) by 10-25%. Such overtime fullness of vehicles does not exceed the
accepted standard of 8 passengers per 1 m2 of the free space in the
salon and, accordingly, will not lead to passengers being refuse service at
stop points along the route. It is considered acceptable in terms of
transportation quality during the morning "peak".
Tab. 2
Evaluation of
express mode parameters on the route from the point of
view of technological transportation efficiency
|
Indicator |
Active technology |
Combined mode №1 |
Combined mode
№2 |
||||
|
|
|
||||||
|
CUST |
Mode |
|
Mode |
|
|||
|
CUST |
Е |
CUST |
Е |
||||
|
Length route, km |
20.4 |
20.4 |
20.4 |
0.0% |
20.4 |
20.4 |
0.0% |
|
20.4 |
20.4 |
||||||
|
Number of buses, units |
25 |
12 |
6 |
-28.0% |
8 |
10 |
-28.0% |
|
18 |
18 |
||||||
|
Number of stops, units. |
27 |
27 |
8 |
-28.1% |
27 |
13 |
-31.1% |
|
19.4 |
18.6 |
||||||
|
Medium length of route part, km |
0.78 |
0.78 |
2.91 |
109.2% |
0.78 |
1.70 |
70.8% |
|
1.6 |
1.3 |
||||||
|
Speed, km/h. |
21.1 |
21.1 |
29.1 |
15.2% |
21.1 |
26.6 |
15.6% |
|
24.3 |
24.4 |
||||||
|
Operating speed,
km/h. |
19.4 |
19.4 |
26.0 |
13.6% |
19.4 |
24.0 |
14.2% |
|
22.0 |
22.2 |
||||||
|
57 |
56 |
||||||
|
Duration of turnover,
min. |
126 |
126 |
94 |
-10.2% |
126 |
102 |
-11.4% |
|
113 |
112 |
||||||
|
Movement interval,
min. |
5 |
10 |
15 |
20.0% |
15 |
10 |
20.0% |
|
6 |
6 |
||||||
|
Number of departures, units |
12 |
6 |
4 |
-16.7% |
4 |
6 |
-16.7% |
|
10 |
10 |
||||||
|
Provided capacity,
pass. |
552 |
276 |
184 |
-16.7% |
184 |
276 |
-16.7% |
|
460 |
460 |
||||||
|
Number
of passengers transported pass. |
829 |
585 |
244 |
0.0% |
386 |
443 |
0.0% |
|
829 |
829 |
||||||
|
Unproductive
transport work, pass. km |
2 471.2 |
62.6 |
154.1 |
-91.2% |
1.3 |
244.0 |
-90.1% |
|
216.7 |
245.3 |
||||||
|
The
coefficient of using bus capacity |
0.78 |
0.99 |
0.96 |
25.4% |
1.00 |
0.95 |
24.4% |
|
0.98 |
0.97 |
||||||
|
Total buses
work, km |
244.8 |
122.4 |
81.6 |
-16.7% |
81.6 |
122.4 |
-16.7% |
|
204.0 |
204.0 |
||||||
|
Bus productivity,
pass/hour. |
66 |
93 |
78 |
31.8% |
92 |
87 |
34.8% |
|
87 |
89 |
||||||
|
Fuel consumption, l/100 km |
26.24 |
26.24 |
19.83 |
-9.8% |
26.24 |
21.5 |
-10.8% |
|
23.68 |
23.40 |
||||||
|
Hourly
fuel consumption, l/h. |
64.24 |
32.12 |
16.18 |
-24.8% |
21.41 |
26.32 |
-25.7% |
5. CONCLUSIONS
The
study is devoted to the development of an algorithm to determine the optimal
parameters for the express buses operating in urban areas. Rational parameters
include the number of buses on the route operating in express ![]() and
normal (stop-based)
and
normal (stop-based) ![]() modes, as
well as the list of stops
modes, as
well as the list of stops ![]() at which
express buses stop. The implementation of such measures can significantly
improve the quality of transport services and transportation efficiency. The
study identifies the list of required initial data to implement the problem.
The developed algorithm consists of the following expanded blocks: verification
of the expediency of introducing an express mode of traffic, determining the
list of stops on the express route, restoring the matrix of interstop
correspondence, redistributing passengers on the route between modes of
traffic, and calculating the technical and operational indicators of bus
operation.
at which
express buses stop. The implementation of such measures can significantly
improve the quality of transport services and transportation efficiency. The
study identifies the list of required initial data to implement the problem.
The developed algorithm consists of the following expanded blocks: verification
of the expediency of introducing an express mode of traffic, determining the
list of stops on the express route, restoring the matrix of interstop
correspondence, redistributing passengers on the route between modes of
traffic, and calculating the technical and operational indicators of bus
operation.
The testing of the developed algorithm for
determining the rational parameters of the express movement was carried out in
the conditions of Dnipro. City route No. 155 (Topolia-3-Vokzalna Square) was
selected as the object of study. The route operates 25 BAZ A81 buses with
capacity of ![]() passengers
in normal mode.
passengers
in normal mode.
According
to the results of the survey of passenger traffic, it was found that the vast
majority of the route parts the share of unproductive transport work ![]() is from
10 to 70% (on average on a route 23%), which significantly reduces the
efficiency of buses. The calculated values of normalized variability and the
uneven passenger traffic ratio on the route (which determine the conditions for
the organization of the relevant modes of traffic on bus routes) are 0.52 and
0.78, respectively, which confirms the expediency of introducing on route No.
155 of the combined mode with express.
is from
10 to 70% (on average on a route 23%), which significantly reduces the
efficiency of buses. The calculated values of normalized variability and the
uneven passenger traffic ratio on the route (which determine the conditions for
the organization of the relevant modes of traffic on bus routes) are 0.52 and
0.78, respectively, which confirms the expediency of introducing on route No.
155 of the combined mode with express.
Three
options for the express route consisting of ![]() ,
, ![]() and
and ![]() stops
were formed. According to the results of the mathematical modeling,
it was found that the maximum efficiency of the passenger transportation
process on route №155 can be achieved in the following two variants of
the combined mode with express: (
stops
were formed. According to the results of the mathematical modeling,
it was found that the maximum efficiency of the passenger transportation
process on route №155 can be achieved in the following two variants of
the combined mode with express: (![]() ) and (
) and (![]() ). This will release 28% of vehicles (28%),
increase the speed of connection by 15%, the coefficient of use of bus capacity
by 24%, and increase hourly productivity by 35%. They would also reduce the
flight duration by 10%; Taking into account the lower fuel costs of buses
operating in express mode, the total operating fuel costs would decrease by
25%.
). This will release 28% of vehicles (28%),
increase the speed of connection by 15%, the coefficient of use of bus capacity
by 24%, and increase hourly productivity by 35%. They would also reduce the
flight duration by 10%; Taking into account the lower fuel costs of buses
operating in express mode, the total operating fuel costs would decrease by
25%.
References
1.
Taran I.,
V. Litvin. 2019. „Determination of rational parameters for urban bus route with
combined operating mode”. Transport
Problems 13(4): 158-171. DOI: 10.20858/tp.2018.13.4.14
2.
Wang X.,
T. Zhou, R. Dai, B. Xue, Y. Sun. 2025. „Integrated design and optimization of
customized bus travel services for urban commuting”. Transportation Letters: 1-14. DOI: 10.1080/19427867.2025.2491532.
3.
Jin, Z.,
H. Mao, D. Chen, H. Li, H. Tu, Y. Yang, M. Attard. 2024. „Multi-objective
optimization model of autonomous minibus considering passenger arrival
reliability and travel risk”. Communications
in Transportation Research 4: 100152. DOI: 10.1016/j.commtr.2024.100152.
4.
Eriksson
E.-L., H. Lidestam, L. Winslott
Hiselius. 2023. „Effects on operating costs of adjusting bus departure times
during peak-hour traffic in Sweden”. Research
in Transportation Economics 100: 101327. DOI: 10.1016/j.retrec.2023.101327.
5.
Chen
Y.-H., Y. Cheng, G.-L. Chang. 2021. „Incorporating bus delay minimization in
design of signal progression for arterials accommodating heavy mixed-traffic
flows”. Journal of Intelligent
Transportation Systems 27(2): 187-216. DOI: 10.1080/15472450.2021.2002149.
6.
Khakimov
B., S. Tanaka. 2024. „Evaluation of the impact of exclusive bus lanes on
traffic in Tashkent”. Asian Transport
Studies 10: 100151. DOI: 10.1016/j.eastsj.2024.100151.
7.
Chen X.,
X. Lin, M. Li, F. He. 2022. „Network-level control of heterogeneous automated
traffic guaranteeing bus priority”. Transportation
Research Part C: Emerging Technologies 140: 103671. DOI:
10.1016/j.trc.2022.103671.
8.
Ai G., X.
Zuo, G. Chen, B. Wu. 2022. „Deep Reinforcement Learning based dynamic
optimization of bus timetable”. Applied
Soft Computing 131: 109752. DOI: 10.1016/j.asoc.2022.109752.
9.
Oliveira
R., P.F. Lima, G. Collares Pereira, J. Martensson, B.
Wahlberg. 2019. „Path Planning for Autonomous Bus Driving in Highly Constrained
Environments”. IEEE Intelligent
Transportation Systems Conference (ITSC): 2743-2749. DOI: 10.1109/itsc.2019.8916773.
10. Wei Y., N. Jiang, Z. Li, D. Zheng, M. Chen,
M. Zhang. 2022. „An Improved Ant Colony Algorithm for Urban Bus Network
Optimization Based on Existing Bus Routes”. ISPRS
International Journal of Geo-Information 11 (5): 317. DOI: 10.3390/ijgi11050317.
11. Khan Z., S. Fang, A. Koubaa, P. Fan, F. Abbas,
H. Farman. 2020. „Street-centric routing scheme using ant colony
optimization-based clustering for bus-based vehicular ad-hoc network”. Electrical Engineering 86: 106736. DOI: 10.1016/j.compeleceng.2020.106736.
12. Euchi J., R. Mraihi.
2012. „The urban bus routing problem in the Tunisian case by the hybrid
artificial ant colony algorithm”. Swarm
and Evolutionary Computation 2: 15-24. DOI: 10.1016/j.swevo.2011.10.002.
13. Zhen L., W. Gu. 2024. „Feeder bus service
design under spatially heterogeneous demand”. Transportation Research Part A: Policy and Practice 189: 104214. DOI: 10.1016/j.tra.2024.104214.
14. Wang J., L. Sun. 2021. „Reducing Bus Bunching
with Asynchronous Multi-Agent Reinforcement Learning”. Proceedings of the Thirtieth International Joint Conference on
Artificial Intelligence: 426-433. DOI: 10.24963/ijcai.2021/60.
15. Ren H., Z. Wang, Y. Chen. 2020. „Optimal
Express Bus Routes Design with Limited-Stop Services for Long-Distance. Commuters. Sustainability 12(4): 1669.
DOI: 10.3390/su12041669.
16. Bazarov B.I., A.A. Ernazarov, Zh.Z. Tozhiev. 2024. „Тechnical and operational evaluation of the
introduction of the express bus service on the city routes of Jizzakh”. Transport:
Science, Technology, Management 10: 44-52. DOI: 10.36535/0236-1914-2024-10-6.
17. Wei H., C. Zhu. 2024. „Optimisation
of Bus Routes in Small and Medium-sized Cities: The Case of No. 7 Bus Route in
Jiaozuo City”. Proceedings of the 2024
International Conference on Rail Transit and Transportation (ICRTT 2024):
104-114. DOI: 10.2991/978-94-6463-610-9_12.
18. Baghbani A., S. Rahmani,
N. Bouguila, Z. Patterson. 2025. „TMS-GNN: Traffic-aware Multistep Graph Neural Network
for bus passenger flow prediction”. Transportation
Research Part C: Emerging Technologies 174: 105107. DOI: 10.1016/j.trc.2025.105107.
19. Bharathi D., L.
Vanajakshi, S.C. Subramanian. 2022. „Spatio-temporal modelling and prediction of bus travel time
using a higher-order traffic flow model”. Physica
A: Statistical Mechanics and Its Applications 596: 127086. DOI: 10.1016/j.physa.2022.127086.
20. Shen J., Q. Liu, Y. Zhang, M. Yu. 2025. „A
novel model incorporating deep learning and Kalman filter augmentation for
route-level bus arrival time prediction with error accumulation mitigation”. Expert Systems with Applications 281:
127622. DOI: 10.1016/j.eswa.2025.127622.
21. Khakimov B., S. Tanaka. 2024. „Evaluation of the impact of
exclusive bus lanes on traffic in Tashkent”. Asian Transport Studies 10: 100151. DOI: 10.1016/j.eastsj.2024.100151.
22. Chen X., H. Guan, Q. Meng. 2025. „Shared use
of dedicated lanes by connected and automated buses and private vehicles: A
multi-green-wave signal control scheme”. Transportation
Research Part E: Logistics and Transportation Review 195: 103965. DOI: 10.1016/j.tre.2025.103965.
23. Jiang Q., Y. Wu, J. Sun, Y. Wang, S. Zhang,
L. Wang, W. He. 2024. „Is a dedicated bus lane operationally and
environmentally beneficial? A case
study in Beijing”. Transportation
Letters: 17(7): 1333-1347. DOI: 10.1080/19427867.2024.2439349.
24. Hollósi J., Á. Ballagi,
G. Kovács, S. Fischer, V. Nagy. 2024. „Bus Driver Head Position Detection Using
Capsule Networks under Dynamic Driving Conditions”. Computers 13(3): 66. DOI:
10.3390/computers13030066.
25. Hollósi J., Á. Ballagi,
G. Kovács, S. Fischer, V. Nagy. 2024. „Detection of bus driver mobile phone
usage using kolmogorov-arnold networks”. Computers 13(9): 218. DOI: 10.3390/computers13090218.
26. Hollósi J., G. Kovács, M. Sysyn, D. Kurhan, S. Fischer, V. Nagy. 2025. „Driver Distraction
Detection in Extreme Conditions Using Kolmogorov-Arnold Networks”. Computers 13(9): 218. DOI:
10.3390/computers13090218.
27. Rosero F., N. Fonseca, Z. Mera, Mera,
J.-M. Mera. 2023. „Assessing on-road
emissions from urban buses in different traffic congestion scenarios by
integrating real-world driving, traffic, and emissions data”. Science of The Total Environment 863:
161002. DOI: 10.1016/j.scitotenv.2022.161002.
28. Naumov V., L. Bekmagambetova, Z. Bitileuova, Z. Zhanbirov, I. Taran. 2022. „Mixed
Fuzzy-Logic and Game-Theoretical Approach to Justify Vehicle Models for
Servicing the Public Bus Line”. Communications
- Scientific Letters of the University of Zilina 24(1): A26-A34. DOI:
10.26552/com.c.2022.1.a26-a34.
29. Kim J., R. Ewing. 2024. „Impact of “light”
bus rapid transit (BRT-light) on traffic and emissions in a travel corridor”. Transport Policy 146: 215-226. DOI: 10.1016/j.tranpol.2023.11.019.
Received 18.06.2025; accepted in revised form 30.09.2025
![]()
Scientific Journal of Silesian
University of Technology. Series Transport is licensed under a Creative
Commons Attribution 4.0 International License