Article
citation information:
Granà, A., Macioszek,
E., Tumminello, M.L. Data-driven trend analysis on sustainable and smart
mobility in Italy. Scientific Journal of
Silesian University of Technology. Series Transport. 2025, 129, 75-95. ISSN: 0209-3324. DOI: https://doi.org/10.20858/sjsutst.2025.129.5
Anna GRANÀ[1], Elżbieta MACIOSZEK[2], Maria Luisa TUMMINELLO[3]
DATA-DRIVEN TREND
ANALYSIS ON SUSTAINABLE AND SMART MOBILITY IN ITALY
Summary. This paper presents a
data-driven trend analysis of sustainable, shared, and zero-crash mobility
within the Italian context, serving as a starting point for research aimed at
assessing the current level of knowledge regarding novel mobility concepts and challenges.
A pilot sample of 30 respondents over the age of 60 years old was selected for the
prototype survey interview conducted to evaluate their knowledge and
perceptions concerning the transition towards sustainable and smart mobility.
Key findings from the interviews provided valuable insights into older adults'
understanding of the topic and their expectations, offering a foundation for
future policies and inclusive initiatives to contextualize Italian experiences
within global trends in sustainable mobility for urban planners and
policymakers.
Keywords: sustainability, cities, smart mobility, road infrastructure, survey interview
1.
INTRODUCTION
Sustainable urban mobility is rapidly advancing
driven by digital innovations and growing environmental awareness, with goals
to reduce emissions and improve road system efficiency and accessibility in
built environments [1,2]. Transforming road infrastructure with smart
technologies and ensuring resilience against challenges like climate change and
urbanization are increasingly essential [3,4]. As urbanization continues – with
over 60% of the European population projected to live in cities – issues such
as traffic congestion, road safety, infrastructure deterioration, and air
pollution have become critical, emphasizing the urgent need for smart mobility
solutions [5]. Road infrastructure plays a vital role in shaping urban dynamics
by impacting economic growth, promoting social inclusion and access to public
transportation, and ensuring environmental sustainability [6]. Well-designed
road systems enhance accessibility for diverse users, emphasizing the need to
understand how evolving infrastructure influences user experiences and societal
trends while supporting eco-friendly innovations for sustainable and safe
mobility [7,8]. To become smarter, road infrastructure should incorporate four
core aspects: self-awareness via real-time monitoring of road conditions and
traffic; interactive information sharing among connected intelligent devices,
sensor networks, and databases; self-adaptation for automatic adjustments to
traffic variations; and energy harvesting from road pavements to power smart
systems [4,9]. In this context, road infrastructure needs advanced
communication, sensors, and data analytics, with smart traffic systems
utilizing real-time data to improve traffic flow and fuel efficiency [9].
Innovations like adaptive traffic signals and vehicle-to-everything
communication can enhance safety and efficiency by enabling communication
between vehicles and infrastructure [10]. The expansion of Big Data via smart
devices and digital communities also allows for extensive data collection while
safeguarding privacy and data quality [7]. However, a holistic design approach
is essential to ensure the resilience of road infrastructure, maintaining the
functionality of roads and intersections under stress [11]. Circularity in road
construction and management is crucial, focusing on sustainable materials,
resource recycling, and waste minimization to balance current needs with future
sustainability [12]. Key questions still include making mobility authentically
smart, developing resilient infrastructure, and integrating circularity with
emerging technologies. Adapting to new mobility models is vital for the future
of cities and residents' well-being.
Based on the above, this study examines trends
in sustainable, shared, and zero-crash mobility in Italy to explore the dilemma
between traditional road network designs and modern urban mobility challenges.
As Italian cities rapidly expand and evolve, it is crucial to adapt road
infrastructure to meet changing transportation needs. Data-driven trend
analysis prompted us to initiate research to assess the current level of
knowledge surrounding sustainable and smart mobility concepts. From an
inclusive perspective, we conducted a prototype survey interview with a pilot
sample of respondents over 60 years old to evaluate their awareness of
sustainable and smart mobility, as well as their perceptions and experiences
related to the topic. The key findings from the face-to-face interview phase
provided valuable contextual insights, deepening our understanding of older
adults' needs and expectations regarding urban mobility. These insights can
serve as a foundation for developing effective policies and inclusive initiatives
that address the specific needs of older adults, while also contextualizing
Italy's experiences within global trends to contribute to the discourse on
sustainable mobility for urban planners and policymakers facing similar
challenges.
After reviewing mobility concepts and
data-driven analysis of sustainable, shared, and zero-crash mobility in Italy
(Section 2), the research methodology involving surveys with elderly
participants is detailed in Section 3. Section 4 presents and analyses the
results, with conclusions in Section 5.
2. INSIGHTS
FROM MOBILITY CONCEPTS AND DATA TRENDS
Urban mobility in Italy is evolving to address
modern challenges and foster healthier and more interconnected communities [13,14].
As urban populations grow and transportation demands increase, sustainable
mobility policies are essential to efficiently manage infrastructure and adapt
to new mobility trends, improving residents' well-being. Smart urban planning
is vital in integrating diverse transport modes – like buses, bicycles, and
shared systems – into a cohesive, inclusive, and environmentally sustainable
network [13-15]. Investments in road infrastructure should encourage active
lifestyles, while advances in connected and automated mobility aim to enhance
traffic management and safety, leading to a more efficient urban transport
system [9]. Data collection is key to understanding mobility trends and creating liveable
cities. In Italy, a centralized system aggregates local authorities' data to
produce annual reports that compare mobility patterns over time (e.g., [14,15]). The following sections analyze
trends in sustainable, shared, and zero-crash mobility in Italy to assess the
current situation.
2.1. Trends in
Sustainable Mobility
Mobility trends indicate
that Italy has a high motorization rate, with about 694 passenger cars per
thousand inhabitants in 2023 [13]. Fig. 1, based on Eurostat data as of January
2025, provides a benchmark for comparing vehicle ownership and usage across EU
countries [13].
Fig. 1.
Motorization rates in the EU 27
Source: data
elaborated by the authors from [13]
In
2023, Italy had the highest car ownership in the EU, surpassing the average of
just under 600 cars per thousand inhabitants. Fig. 2 compares passenger car
counts per thousand inhabitants in Italy and major EU economies like France,
Germany, Spain, and Poland over the years. Urban mobility data indicate rising
vehicle motorization rates in Italian cities, with progress towards sustainable
transportation lagging, emphasizing the need for stronger efforts to promote
greener options. Although use of bicycles, public transport, and electric
vehicles is increasing, the share of low-emission cars remains relatively
modest [14].
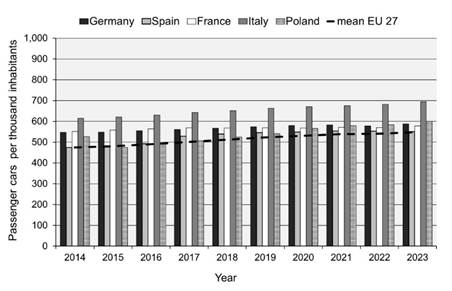
Fig. 2.
Passenger cars per thousand inhabitants in European countries.
Note: mean EU is the mean value recorded in the EU countries
per year during the considered timeframe
Source: data
elaborated by the authors from [13]
Fig. 3 shows Italy's motorization rates from
2018 to 2023, measured as passenger cars per thousand inhabitants, categorized
by geographical area and city type – metropolitan city capitals (larger urban
areas) and provincial capitals (main cities of provinces). Differences among
macro-areas are influenced by variations in road infrastructure and public
transport. Densely populated Italian cities often have lower motorization rates
due to available public transport, walkable environments, and cycling options,
which reduce reliance on private cars and promote sustainable mobility. These
geographical differences in 2023 show variation from previous years [14]:
northern capitals have 612 passenger cars per thousand inhabitants, central
capitals 660, and southern capitals 662 (see Fig. 3a). Larger metropolitan city
capitals average 609 cars per 1,000 inhabitants, while provincial capitals have
687, compared to the overall average of 648 per thousand inhabitants across all
capitals [14]. Cities with extensive public transport, especially in northern
areas (see Fig. 3a) and metropolitan city capitals (see Fig. 3b), tend to have
lower motorization rates due to better public transport options [14]. In 2023,
most Italian metropolitan capitals experienced higher motorization rates
compared to 2018, except Turin, which slightly decreased from 640 to 638 cars
per 1,000 inhabitants. Notably, Southern cities like Naples, Palermo, Messina,
and Catania saw the largest increases [14]. Between 2021 and 2023, vehicle
density – vehicles per kilometre of urbanized area – was about 60% higher in
metropolitan capitals than in provincial capitals [14]. Further details are
provided in Fig. 4. Fig. 4a features a stacked bar chart illustrating the
annual percentage changes in passenger cars by fuel type – gasoline, diesel,
and low-emission cars (such as gas or bi-fuel, electric, and hybrid) – in
Italian cities from 2018 to 2023 [14,15]. Between 2018 and 2023, the growth of
gasoline cars slowed by about 6%, and diesel cars by 12%, largely driven by a
rise in low-emission vehicles, which accounted for approximately 50% of new
registrations since 2020 [14]. In 2023, Venice has one of the lowest shares of
gasoline cars, while Rome and Milan lead in low-emission vehicle adoption.
Southern cities like Naples, Palermo, and Cagliari also closely follow in
embracing low-emission options [14]. Fig. 4b presents the pollution potential
index of passenger cars by city capital type, evaluating vehicle composition
based on emission class (Euro 1 to Euro 6) and fuel type (gasoline, diesel,
gas, bi-fuel, electric, and hybrid).
|
|
|
(a) |
|
|
|
(b) |
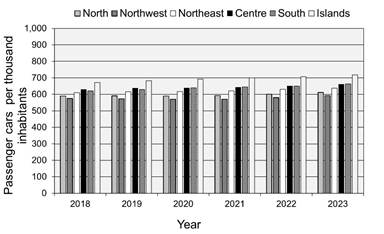
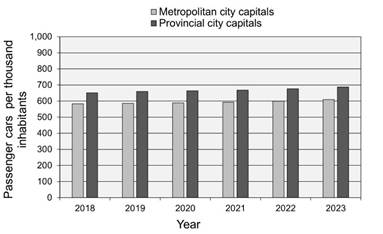
Fig.
3. Motorization rates in
passenger cars per thousand inhabitants in Italy by
(a) geographical area and (b) type of city (metropolitan city capitals and
provincial capitals)
Source: data elaborated
by the authors from [14]
Vehicles
are categorized into high, medium, or low pollutant potential levels: high
(Euro 0 to Euro 3), medium (Euro 4 to Euro 6), and low (gas or bi-fuel,
electric, and hybrid vehicles). Notably, Euro 0 cars, registered before
December 31, 1992, are included, while pre-Euro 4 hybrid cars are excluded from
the low pollutant potential category [14]. The pollution potential index is 100
when high-and low-polluting vehicles are equal in number. Values above 100
indicate more high-polluting vehicles, while values below 100 signify a
dominance of low-polluting vehicles. Overall, data shows a consistent decrease
in pollutant potential over time (see Fig. 4b). However, in southern cities
with older vehicle fleets, the indicator remains higher in 2023 compared to the
North and Centre, where there's a closer balance between polluting vehicles and
low-emission options compared to the South [14,15].
The
energy transition is advancing gradually, with electric cars remaining a small
proportion compared to gasoline vehicles. Since 2019, the adoption of
low-emission cars has increased, mainly due to the rise of hybrid vehicles
combining electric and combustion engines.
|
|
|
(a) |
|
|
|
(b) |
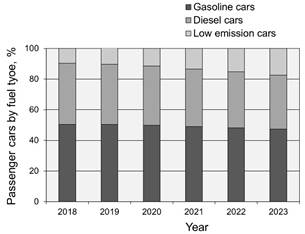
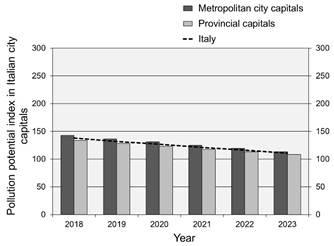
Fig.
4. Environmental indicators in Italy (2018-2023): (a) Passenger cars
percentages by fuel type; (b) Pollution potential index of cars by city
capital, compared to Italy's overall trend based on averages from provincial
and metropolitan city capitals
Source: authors' elaboration based on [14,15]
However,
the largest segment continues to be gas (methane or LPG) and bi-fuel cars,
still classified as fossil fuel-powered (see Fig. 5). Italy has the highest car
ownership in the EU but is gradually transitioning towards sustainable
transportation. Despite the increasing adoption of low-emission vehicles, older
and more polluting cars are still widespread, particularly in the South. Recognizing
regional disparities underscores the urgent need to enhance public
transportation and promote shared mobility solutions. Ongoing monitoring, data
collection, and strategic planning are crucial to fostering greener mobility in
Italian cities.
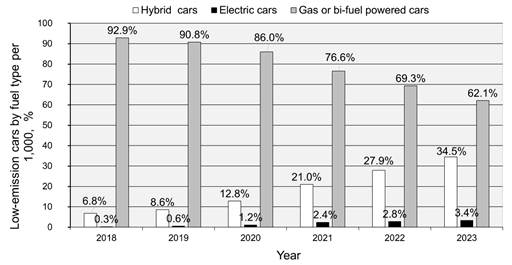
Fig. 5.
Percentages of low-emission cars by fuel type per 1,000 cars
Source: data
elaborated from the authors from [14]
2.2. Trends in
Shared Mobility
Shared
mobility is transforming traditional transportation into a more innovative and
environmentally friendly model [16]. Bike-sharing, car-sharing, carpooling,
scooter-sharing, and on-demand services improve efficiency, decrease dependence
on private vehicles, and promote conservation and equity through shared use
rather than ownership [17].
Bike-sharing
services include: 1) Station-based systems – comprising low-tech options, some
outdated but still functional, which rely on codes or keys at georeferenced
stations – and dock-based systems where bikes are secured in racks and accessed
with magnetic cards; 2) Free-floating fleets accessible anywhere within the
area; 3) GPS-based systems that reserve or unlock bikes via an app; and 4)
Peer-to-peer sharing offered by individuals through specialized platforms.
Car-sharing allows users to rent vehicles for trips, promoting cost-sharing and
reducing ownership burdens by treating cars as temporary, consumable assets
[17]. Types of car-sharing include 1) Station-based services with fixed pickup
and return stations; 2) Free-floating services, allowing users to pick up and
return cars within the operational area; and 3) Peer-to-peer sharing, where
private owners share their cars via a platform without involving rental
companies. Carpooling involves informal arrangements where individuals share a
vehicle on the same route, with drivers providing the car and passengers
sharing fuel and travel costs, with instant carpooling via platforms and apps
being the most common [17]. Scooter-sharing services, like bike-sharing,
involve renting scooters for travel within the service area and typically
include a helmet stored in the scooter. On-demand transportation services –
such as taxis and modern apps like Uber – enable users to book shared trips
quickly via smartphones [17]. All sharing mobility services possess key characteristics
that enhance effectiveness and user experience [18]. Modern mobility services
prioritize shared transportation, operating alongside or after private vehicles
like public transit and taxis. Using digital platforms and GPS, they connect
drivers and passengers for on-demand, flexible, and scalable options, helping
to reduce urban congestion and CO2 emissions. Fig. 6 shows the
supply and demand trends for shared mobility in Italy from 2015 to 2023,
including the number of vehicles for car-sharing, bike-sharing, motor scooters,
and e-scooter sharing (Fig. 6a), as well as mileage data (Fig. 6b). Notably,
e-scooter sharing services began in 2019, saw significant growth until 2022,
and experienced a decline in 2023 [19].
In
2023, shared mobility in Italy totalled nearly 200 million kilometres travelled,
a 45% rise since 2021 in the post-COVID period (see Fig. 6b). A further 7%
increase is projected for 2024 based on first-quarter data [19]. The vehicle
composition in 2023 included bikes (14%), e-bikes (28%), motor scooters (5%),
e-scooters (44%), electric cars (3%), and gasoline cars (6%), reflecting a
shifting landscape in shared mobility trends [19].
|
|
|
(a) |
|
|
|
(b) |
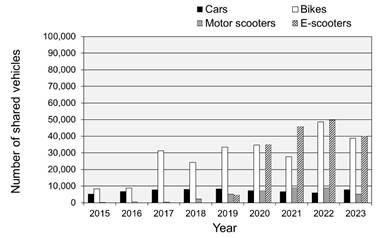
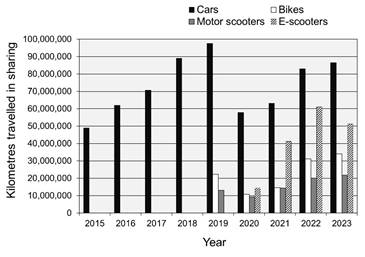
Fig. 6. Trends of supply and demand for shared mobility
in Italy:
(a) Number of shared vehicles, (b) Kilometres travelled in sharing.
Note: car-sharing and bike-sharing services include both free-floating
and station-based options
Source: data elaborated from
the authors from [19]
Fig.
7 shows the supply and demand trends for car-sharing and bike-sharing in Italy
(2015-2023), focusing on free-floating (FF) and station-based (SB) models. The
number of FF
car-sharing services is increasing, while SB car-sharing decreased by 27% in
2023 compared to 2022 and by 17% compared to 2021 (Fig. 7a). Since 2020, the
number of vehicles in FF
car-sharing has been recovering, whereas the vehicle count in SB car-sharing
has remained stable at around 1,200 vehicles (Fig. 7b).
SB
car-sharing achieved approximately 300,000 rentals in each of the last two
years, despite a slight reduction in FF car-sharing during the same period
(Fig. 7c). Meanwhile, distances travelled by FF car-sharing increased by 52% in
2023 compared to 2020, reaching about 78 million kilometres in 2023,
demonstrating greater resilience to the effects of the pandemic (Fig. 7d)
[19].
|
|
|
|
(a) |
(b) |
|
|
|
|
(c) |
(d) |
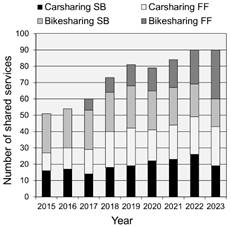
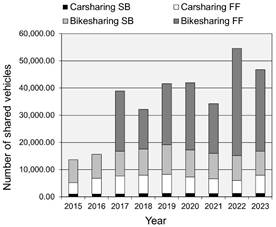
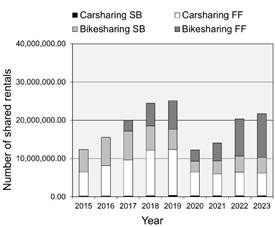
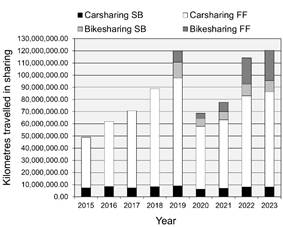
Fig. 7. Trends of supply and demand for car-sharing e
bike-sharing in Italy:
(a) Number of shared services, (b) Number of shared vehicles, (c) Rentals
and (d) kilometres travelled.
Note: Shared services include free-floating (FF) and station-based (SB) models
Source: data elaborated by authors from [19]
The
data shows that FF bike-sharing services increased by 76% in 2023 compared to
2021, while SB services declined by 26% over the same period (Fig. 7a). The
number of bikes in SB services remained stable during the period shown in Fig.
7b. In contrast, bikes in FF services decreased by 26% in 2023 compared to
2022, mainly due to fleet downsizing in major cities like Rome and Milan. The
supply level in 2023 is expected to be maintained through 2024 [19]. Electric
bikes constitute 62% of Italy's shared bicycle fleet in FF services, driven by
the adoption of hourly and daily rental options [19]. Demand for bike-sharing,
particularly in rentals, grew significantly between 2022 and 2023 for FF
services, with further growth forecasted (Fig. 7c) [19]. Additionally,
distances travelled increased by 15% in 2023 compared to the previous year,
totalling around 25 million kilometres in FF bike-sharing (Fig. 7d).
A
questionnaire was distributed to over 10,000 shared mobility users via app
pop-ups, newsletters, and social media to assess perceptions of shared mobility
as public transportation [19]. The survey was designed to mask its objectives
and ensure anonymity, encouraging genuine responses about the benefits of these
services and potential shifting usage preferences. The main feedback showed
that three out of four users expressed positive opinions about the development
of available shared mobility services. Car sharing received only 42% positive
responses, lagging behind other services. Additionally, over 80% of users
indicated that the closure of shared mobility services in their city would
greatly impact their mobility habits. On financial support for vehicle-sharing
services, 63% of users favoured it, 24% agreed with conditions, while only 7%
opposed public funding. Data on on-demand transport services showed that over
600,000 passengers were transported in 2023 [19]. Service offerings increased
significantly, especially in northern regions, tailored to specific contexts
and addressing local mobility needs with both seasonal and year-round options.
2.3. Trends in
Zero-Crash Mobility
Road safety is a shared responsibility among all
road users and professionals. Frequent crashes result in loss of life and
property damage, impacting community safety. Zero-Crash mobility refers to a
transportation system or approach aimed at eliminating road traffic crashes and
fatalities. The goal is to create a safer mobility environment where advanced
safety technologies, intelligent infrastructure, and comprehensive safety
strategies protect all road users like drivers, passengers, pedestrians, and
cyclists [20,21]. Achieving this requires balancing the components of the road
system and their interactions within natural and built environments, as
illustrated in Fig. 8.
Fig. 8. Framework for understanding the functionality of
the road safety system
Effective road design should be clear and
intuitive, with suitable slopes and materials that encourage safe vehicle
speeds and smooth traffic flow [20]. While improved safety generally reduces
crashes and their severity, managing road safety remains complex due to the
unpredictable nature of crashes. In this context, Fig. 9 outlines the key
aspects essential for achieving zero-crash mobility.
Engineering measures and countermeasures
significantly impact road safety, which depends on the quality of road
infrastructure and its link to crash frequency. Security pertains to users’
personal feelings of safety and perceptions of infrastructure reliability.
Although safety and security are related, the focus is on assessing road safety
across different infrastructure segments and intersections to identify
effective interventions that enhance overall safety [21].
In Italy, a road crash is defined according to
the 1968 Vienna Convention [22] as an event involving at least one vehicle –
stationary or moving—on a traffic-accessible road resulting in injuries or
fatalities within 30 days.
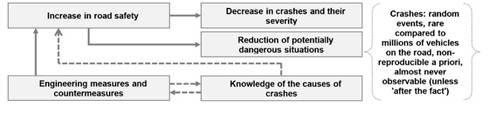
Fig. 9. The logical pathway of zero-crash mobility.
Data are collected nationally and officially
recorded by law enforcement. This definition serves as a benchmark for
comparing crash data to the first six months of 2019, which is the reference
year for the European Commission's 2030 goal [21]. Compared to 2019, Italy has
globally experienced a decline in road crashes (4.0%), injuries (8.0%), and
fatalities (~7%), reflecting progress towards safer mobility.
Preliminary data for the first half of 2024 show
a slight increase in road crashes causing injuries compared to the same period
in 2023, with crashes (+0.9%), injuries (+0.5%), and fatalities within thirty
days (+4.0%) [22]. This trend suggests that Italy is moving away from European
road safety targets, underscoring ongoing challenges in road safety management
and the need for effective interventions. In the first half of 2024, highway
fatalities decreased by 14.0% compared to the same period in 2023, while
fatalities on urban and rural roads increased by 8.0% and 1.0%, respectively.
Compared to the first half of 2019, highway fatalities declined significantly
by 32.0%, rural road fatalities decreased modestly by 4.0%, but urban road
fatalities rose slightly by 1.0% [22]. However, complete official data for 2024
are needed for a definitive analysis.
Data for the first four months of 2024 indicates
a 3% increase in vehicle kilometres travelled on highways compared to 2023,
driven mainly by a 4% rise in heavy vehicle traffic and a 3% increase in light
vehicle volumes [21,22]. In the first half of 2024, new car registrations
increased by about 5%, and motorcycle registrations rose by 6% compared to the
same period in 2023. However, compared to 2019, new car registrations declined
by 16.5%, while motorcycle registrations increased significantly by 47.5%. Provisional
data for January to June 2024 indicates that 73% of crashes occurred on urban
roads, while rural roads have the highest fatality rate at 47%. On highways,
crashes and fatalities represented 6% and 8%, respectively [22]. Data on
crashes involving personal injuries related to shared micromobility in Italy
has also been collected from insurance company reports and law enforcement,
including user-reported events [22]. Notably, crashes were recorded even
without formal reports or hospitalizations. In 2023, there were 637 recorded
crashes, including one fatal e-scooter crash in Rome. The incidence of crashes
associated with shared micromobility services appears to be decreasing, likely
due to increased user familiarity, with higher rates observed during the
initial months of service. Fig. 10 shows crashes per 100,000 km in Italy for
2021–2023 [19].
Preliminary data reveal contrasting trends
between crashes and shared micromobility usage. To meet Europe's 2030 road
safety goals, Italy needs a comprehensive approach that leverages big data for
detailed analysis and targeted interventions [21].
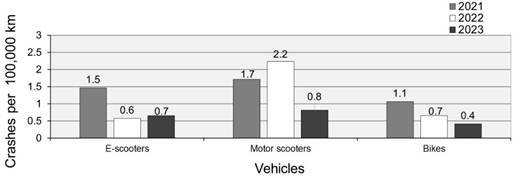
Fig. 10. Crashes in shared micromobility services per
100,000 km in 2021-2023
Source: data elaborated by the authors from [19]
3.
INVESTIGATION THROUGH A SURVEY INTERVIEW FOR THE ELDERLY: WHAT DO THEY KNOW
ABOUT SUSTAINABLE AND SMART MOBILITY?
Mobility trends in Italy
are increasingly centred on sustainable and smart solutions to enhance
transportation and residents’ quality of life. Understanding the perceptions of
diverse groups, especially the elderly, is essential for developing inclusive
policies. Community surveys can provide valuable insights into their knowledge,
attitudes, and experiences regarding sustainable mobility and related concepts.
This initial investigation aims to promote inclusivity by listening to user
groups that may be marginalized during the digital transition, with ongoing
improvements envisaged.
3.1.
Explaining the Survey Methodology
Recognizing that the
survey interview was in its prototype phase, the authors conducted the research
action following specific steps as follows:
1. The first
step involved designing a structured survey interview that addressed key
aspects of sustainable and smart mobility. The prototype questionnaire
consisted of 16 closed-ended questions, with the first five providing
informational content. These included demographic questions to contextualize
the data, such as age, educational qualifications, gender, cultural identity,
and a question about smart cities to assess participants' understanding of the
concept, expressed in English (see Table 1). Other questions addressed concepts
such as smart mobility, smart roads, shared mobility, road infrastructure,
autonomous vehicles and willingness to use them, car-sharing services,
connected and automated mobility, low-emission cars, and micromobility. Each
question provided a minimum
of three alternative options to guide participants'
responses (see Table 2). The final question concerns participants' preferences
regarding the mode of questionnaire administration (face-to-face interview or
email) to understand their inclinations. Gathering feedback on participants'
preferred delivery methods can facilitate a more personalized and accessible
research approach, ultimately enhancing the effectiveness of the surveys and
enabling the optimization of data collection methods for future studies.
2. The
second step involved selecting the pilot sample. It was decided to limit the
administration of the questionnaire to 30 older adults living in urban areas in
Sicily, Italy. Half of the participants would reside in a metropolitan city
with a population exceeding 600,000 but below 700,000, while the other half
would live in a town with a population of approximately 50,000; population
classes were based on official data as of January 1, 2024 [23]). Understanding
participants' diverse backgrounds reveals disparities in mobility knowledge and
access, with older adults in urban areas experiencing different challenges
compared to those in rural areas, where transportation options are often
limited. None of the respondents were engineers or worked in the engineering
field, which resulted in a limited number of interviews during this phase.
3. The third
phase involved conducting face-to-face interviews using the prototype
questionnaire consisting of 16 closed-end questions (see Tables 1,2), with 30
participants over the age of 60 years old who voluntarily agreed to participate. Participants
were assured of anonymity and informed that data would be used solely for
informational purposes. Researchers directly engaged with them, clarifying the
questionnaire and objectives, and encouraged sharing experiences on urban
mobility to identify knowledge barriers and gather insights into older adults'
challenges and opinions.
4. After
administering the questionnaire, the fourth step involved processing the
collected data to ensure accuracy and reliability. Quality checks were
conducted to identify inconsistencies or errors. The data were then coded and
organized into a database to facilitate the analysis; all information was
handled anonymously for privacy reasons, based on the exclusively informational
purpose of the research.
Key findings from elderly
respondents will be presented in the next section.
Tab. 1
The preliminary questions (PQ1 to PQ5) and the
alternative answers
|
No |
Questions |
Alternative answers |
|
PQ.1 |
How old
are you? |
a. Between
60 and 65. b. Over 65
and under 75. c. Over
75. |
|
PQ.2 |
What is
your educational qualification? |
a. High school diploma*. b. Master’s degree. c. PhD. d. I
prefer not to say. |
|
PQ.3 |
What is
your gender? |
a. Male. b. Female. c. I
prefer not to say. |
|
PQ.4 |
How do you
identify your origin? |
a. I am Italian. b. I am European. c. I
prefer not to say. |
|
PQ.5 |
Have you
ever heard of Smart Cities? |
a. Yes, many times. If yes, please specify (news on TV, radio,
documentaries, books, internet) b. No. c. I don’t
know. |
* In the case of a middle school diploma (msd), the answers will also be reported as a separate
category
Tab. 2
The closed-end questions (Q1 to Q11) and the
alternative answers
|
No |
Questions |
Alternative answers |
|
Q.1 |
What does
smart mobility mean? |
a. Smart
mobility represents an intelligent and eco-sustainable transportation
approach that uses digital technologies to optimize mobility. b. Smart
mobility is fast mobility with small-displacement cars. c. Smart
mobility is represented by motorcycles, helicopters, and motorboats. |
|
Q.2 |
What does
Smart Road mean? |
a. A smart
road is a fast-flowing road. b. Smart
roads, or intelligent roads, are road infrastructures equipped with advanced
technologies to monitor traffic, enhance safety, and promote sustainability. c. A
small-sized car, such as a city car. |
|
Q.3 |
How would
you define shared mobility? |
a. Sharing
mobility is a form of transportation exclusively for private vehicles
purchased in installments. b. A
transportation method that uses only public transport and intercity and
metropolitan trains. c. Sharing
mobility allows for the sharing of vehicles and routes, making transportation
more interactive and efficient, while also reducing expenses and consumption
associated with owning a vehicle. Examples include car-sharing and bike-sharing. |
|
Q.4 |
What comes
to mind when you think of road infrastructure? |
a. The
materials used to create a stable and durable road surface. b. In the
context of land transportation, road infrastructure refers to the collection
of road networks and roads. c. The
construction of skyscrapers. |
|
Q.5 |
What is an
autonomous vehicle? |
a. An
autonomous vehicle is a car capable of sensing road conditions and driving
without human intervention. b. A
vehicle that belongs to a single owner. c. A
vehicle designed exclusively for the transportation of heavy goods and
hazardous materials. |
|
Q.6 |
Are you
willing to use an autonomous vehicle? |
a. Yes. b. No. c. Maybe. |
|
Q.7 |
What is a
car-sharing service? |
a. A
support service for the purchase of zero-kilometre vehicles. b. Car
sharing is a service that allows you to rent vehicles for short periods,
sharing the costs and facilitating booking through an app or website. c. A
travel agency that organizes long-distance car tours. |
|
Q.8 |
What does
connected automated mobility mean? |
a.
Connected and automated mobility is synonymous with cooperative mobility in
sharing data and resources to promote congestion. b.
Connected mobility uses technologies for real-time communication, while
automated mobility employs autonomous vehicles. c. A
transportation method based solely on bicycles. |
|
Q.9 |
What is a
low-emission vehicle? |
a. A
vehicle powered by gas or bi-fuel, electric, or hybrid engines. b. A
vehicle that can operate only on solar energy. c. A
vehicle that consumes more fuel than traditional models. |
|
Q.10 |
What comes
to mind when you hear the word “micromobility”? |
a. Light
vehicles for short trips in the city, such as e-scooters. b. Light
air transport. c. Large
cars designed for large families. |
|
Q.11 |
Would you
have preferred to receive the questionnaire via email? |
a. Yes. b. No. c. I
prefer not to answer |
4. THE RESULTS
AND THEIR ANALYSIS
This section highlights
key findings from elderly respondents regarding their perceptions and
experiences with sustainable and smart mobility. Fig. 11 displays responses to
preliminary questions PQ.1,2,3,4 in Table 1.
The data on age (PQ.1)
helped characterize the sample, revealing that 53% of respondents are aged
between 65 and 75. This information is useful for analyzing age-related effects
on understanding and knowledge of contemporary mobility and sustainability issues.
Additionally, PQ.2 explored participants' education levels with four options:
(a) high school diploma, (b) master’s degree, (c) doctorate, and (d) no answer.
This data aims to assess the potential correlation between education and
awareness of the discussed topics. The results showed that 40% of respondents
hold a high school diploma, 33% have a master's degree, none have a PhD, and 7%
chose not to disclose their education level (but 20% possess only a middle
school diploma). Regarding gender (PQ.3), participants were asked to identify
their gender, selecting from male (40%), female (57%), or no answer for the
remaining respondents. This information was used to analyze
potential differences in experience related to the discussed themes. In
response to question PQ.4, 90% indicated they are Italian, and 10% stated they
are European. The origin, or cultural identity, of participants, through three
options by identifying as (a) Italian, (b) European, or (c) choosing not to
indicate their origin, can support the characterization of the socio-cultural
context for the responses given thereafter. Question PQ.5 assessed
participants' familiarity with Smart Cities, revealing that 20% had frequently
heard about the concept through TV or documentaries, although three of them did
not specify their sources. One participant mentioned learning about it from
"work," despite no engineers or industry professionals being involved
in the survey. Conversely, 67% had never heard of smart cities, 10% responded
"I don't know," and the remaining participants did not answer.
|
|
|
|
(a) |
(b) |
|
|
|
|
(c) |
(d) |
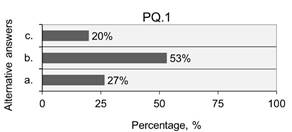
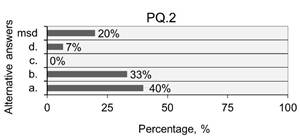
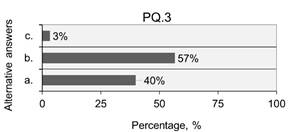
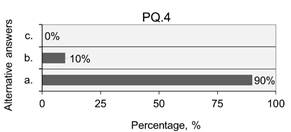
Fig. 11. The respondents' answers to the preliminary
questions in Table 1 are as follows:
(a) PQ.1 pertains to age, (b) PQ.2 concerns education level, (c) PQ.3 relates
to gender,
(d) PQ.4 addresses cultural identity. Note: Items a, b, c, and d (where
present) are detailed in Table 1; "msd"
stands for middle school diploma
Fig. 12 presents the most significant results
related to questions from Table 2 (e.g., Q.1, Q.2, Q.4, Q.5, Q.8, and Q.9). For
brevity, the remaining questions and their corresponding answers will be
described and discussed only briefly.
In response to the question about the meaning of
smart mobility (Q.1), 83% of respondents recognized it as an intelligent and
eco-sustainable transportation approach that uses digital technologies to
optimize mobility. Conversely, 17% associated smart mobility with speed and
small-displacement cars, potentially due to a lack of familiarity with related
English terms or expressions, which are generally considered part of the
current vocabulary by experts (see Fig. 12a). All the interviewees exclude that
smart mobility is represented by motorcycles, helicopters, and motorboats. In
response to Q.2 (see Fig. 12b), around 27% mistakenly linked the smart road
concept to a fast-flowing road as highways, while around 67% appropriately
associated it with road infrastructures that utilize advanced technologies for
traffic monitoring, safety enhancement, and sustainability, potentially
influenced by the attribute 'intelligent' present in the answer choices (see
Table 2). The remaining respondents were evenly split between choosing a
small-sized car, such as a city car, as an alternative answer, and selecting no
suitable options. Regarding the definition of sharing mobility in response to
Q.3 in Table 2, 80% of respondents agreed on the correct answer (c), which is
that sharing mobility allows for the sharing of vehicles (such as cars and
bikes) and routes, making transportation more interactive and efficient while
also reducing expenses and consumption associated with owning a vehicle.
However, one respondent, unsure, also attributed the concept of sharing
mobility to the first option in Table 1 (i.e., sharing mobility as a form of
transportation exclusively for private vehicles purchased in installments). The
remaining respondents were evenly split among the other two options.
|
|
|
|
(a) |
(b) |
|
|
|
|
(c) |
(d) |
|
|
|
|
(e) |
(f) |
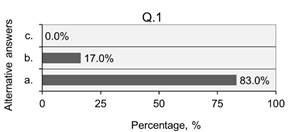
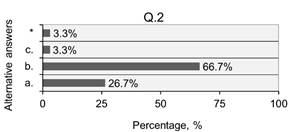
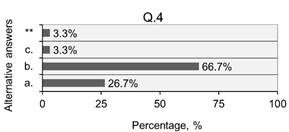
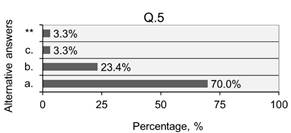
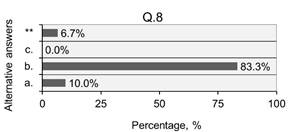
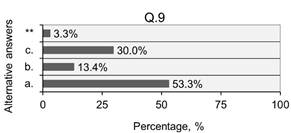
Fig. 12. The
answers provided by the respondents to the questions in Table 2:
(a) Q.1 pertains to smart mobility, (b) Q.2 pertains to smart roads, (c) Q.4
pertains to road infrastructure, (d) Q.5 pertains to autonomous vehicles, (e)
Q.8 pertains to connected automated mobility, and (f) Q.9 pertains to
low-emission vehicles. Note: Items a, b, and c are detailed in Table 2; (*)
indicates that the respondents do not find answers among the options provided,
while (**) indicates no answer was given
Regarding the responses to the question Q.4 (see
Fig. 12c) about "road infrastructure", they reveal important insights
into how people perceive the concept. Most respondents (67%) associated road
infrastructure with the road networks and roads within the context of land
transportation. This suggests that the concept primarily evokes the idea of
connectivity and the organizational structure of transport systems,
highlighting their role in promoting travel and commerce. On the other hand, around
27% of the responses linked the term to the materials used for creating stable
and durable road surfaces. This indicates an awareness of the technical aspects
of road construction, acknowledging that the quality of materials is crucial
for the longevity and safety of roadways. It is also noteworthy that two
respondents associated road infrastructure with both options (i.e., a and b in
Fig. 12c), reflecting a more comprehensive understanding of the topic that
encompasses both the physical elements and the broader network of routes. The
exclusion of skyscrapers (see Q.4, option c in Table 2) in their associations
highlights a clear delineation between structures and infrastructure (i.e.,
only one respondent selected option c for Q.4 in Table 2). Respondents likely
view road infrastructure as distinct from building construction, focusing on
transportation rather than urban architecture. In turn, the fact that one
respondent did not provide an answer could suggest either a lack of familiarity
with the topic or ambiguity in the understanding of road infrastructure,
indicating that public knowledge on this subject may vary, which ideally it
should not.
Regarding the question, 'What is an autonomous
vehicle?' (Q.5), Fig. 12d shows that 70% know that an autonomous vehicle is a
car capable of sensing road conditions and driving without human intervention;
additionally, 23% imagined that it is a vehicle that belongs to a single owner;
one respondent associated it with a vehicle designed exclusively for the
transportation of heavy goods and hazardous materials, while one respondent did
not answer this question. However, 57% were not willing to use an autonomous
vehicle, while the remaining respondents were equally divided between being
willing to test an autonomous vehicle and expressing uncertainty (see Q.6 in
Table 2). The high percentage of respondents recognizing autonomous vehicles as
self-driving suggests growing awareness of advanced technologies. However, the
reluctance to use them (57%) may stem from safety concerns, mistrust in
technology, or lack of understanding about their reliability. The varied
perceptions, from ownership to specific use cases, highlight a need for better
public information and outreach to address misconceptions and enhance
acceptance of autonomous vehicles.
Confirming the understanding of shared mobility
from Q.3, in Q.7 in Table 2, 57% of respondents associated the concept of
car-sharing services with option (b), which involves renting vehicles for short
periods, sharing the costs, and facilitating bookings through an app or
website. Meanwhile, 37% associated it with "a support service for the
purchase of zero-kilometre vehicles", while the remaining respondents did
not answer. Furthermore, concerning Q.8 in Fig. 12e about connected and automated
mobility, 83% answered the question indicating that connected mobility uses
technologies for real-time communication, while automated mobility employs
autonomous vehicles. Meanwhile, 10% incorrectly attributed it to means of
promoting congestion, and only two respondents did not answer. Appropriately,
none associated it with bikes. The understanding of connected mobility
emphasizes awareness of technology’s role in communication, while
misattributions to congestion reflect a possible lack of comprehensive
knowledge. The absence of bike associations may indicate overlooked
alternatives in mobility solutions.
Regarding Q.9 in Fig.
12f, 16 respondents stated that a low-emission vehicle is powered by gas or
bi-fuel, electric, or hybrid engines (option “a” in Table 2), while only 4
indicated that it is a vehicle that can operate solely on solar energy (option
“b” in Table 2). Nine respondents incorrectly identified it as a vehicle that
consumes more fuel than traditional models (option “c” in Table 2), and one
respondent did not answer. The varied responses to Q.9 indicate a general
awareness of low-emission technologies, but misconceptions about solar energy
and fuel consumption persist, highlighting the need for improved education on
sustainable vehicle options.
Regarding Q.10 in Table
2, 93% of respondents linked micromobility to light vehicles for short city
trips, such as e-scooters, showing strong awareness of modern urban transport
options, while the remaining respondents did not provide an answer. About 73%
were not willing to receive the questionnaire via email, while the remaining
respondents were evenly split between giving a positive answer and choosing not
to answer (see Q.11 in Table 2). The reluctance to participate via email
suggests potential privacy concerns or preferences for different communication
methods, highlighting the need for varied engagement strategies. Despite the small sample size, the insights
offered are valuable, emphasizing the importance of effective communication
about infrastructure development to better engage the public and assess the
social impact of novel technologies integrated in transport services and road
design. Future efforts should expand the sample to identify broader
relationships and involve experts, as well as explore other methods to reach
the target respondents.
5. CONCLUSIONS
Starting from
data-driven trend analysis, road infrastructure is crucial for sustainable
urban mobility, requiring investments in public transport, bicycle lanes, and
pedestrian areas to reduce congestion and pollution. Incorporating smart
technologies enhances traffic management and safety, while multimodal solutions
– combining transit, cycling, walking, and eco-friendly fuels – improve
accessibility and urban quality of life. Prioritizing pedestrian-friendly
infrastructure and supporting emerging technologies like autonomous vehicles
and ridesharing promote cleaner air and digital communities. As Italy’s
mobility concepts evolve, inclusive policies that consider diverse groups,
especially the elderly, are essential to assess their social impact. Engaging
older adults through surveys provides valuable insights into their awareness,
attitudes, and experiences, ensuring their active participation and preventing
marginalization in sustainable and smart mobility initiatives.
Do the Elderly Know It's
Sustainable Mobility? This study sheds light on elderly respondents'
perceptions of sustainable and smart mobility. Most participants were aged
65-75, with many holding only a high school diploma, suggesting potential links
between age, education, and understanding of modern mobility concepts. Given
the level of education of the respondents and the number of correct answers,
the understanding of the topic is quite good. While 83% recognized smart
mobility as environmentally friendly and digitally enhanced, misconceptions
still existed, such as associating it with speed or limited terminology
familiarity. Knowledge about road infrastructure, autonomous vehicles, and
connected mobility varied; some correctly identified key features, but gaps
remained, like linking traffic congestion to connected mobility or
misunderstanding low-emission vehicle capabilities. A notable 57% were hesitant
to use autonomous vehicles, mainly due to safety and trust concerns,
highlighting the need for better public education. The high awareness of
micromobility (93%) indicates openness to urban solutions. However, reluctance
to engage via email underscores privacy concerns, emphasizing the importance of
diverse communication channels for effective outreach.
Despite the small sample
and provisional nature of the questionnaire, these findings emphasize the
critical importance of implementing targeted communication and education
strategies to improve understanding and acceptance of sustainable and smart
mobility. Developing inclusive policies is essential to ensure that innovative
mobility solutions address the diverse needs of all groups, especially
vulnerable populations. Such policies help prevent marginalization, promote
social equity, and foster greater societal participation.
Future research
involving larger, more diverse samples and expert input in questionnaire design
will support the development of comprehensive, culturally sensitive outreach
strategies. Promoting inclusivity strengthens social cohesion and guarantees
that sustainable mobility benefits everyone, contributing to more resilient and
equitable urban environments.
Acknowledgements
This research has
been partially supported by the European Union - NextGenerationEU – National
Sustainable Mobility Center CN00000023, Italian Ministry of University and
Research Decree n. 1033 –
17/06/2022, Spoke 9, CUP B73C22000760001. The authors also thank the interviewees for
the spontaneity with which they embraced our initiative.
References
1.
Papadakis Dimitrios Minas, Andreas Savvides,
Michael Aimilios, Apostolos Michopoulos. 2024. „Advancing sustainable urban
mobility: insights from best practices and case studies”. Fuel Communications 20. 1-18. ISSN: 2666-0520. DOI: https://doi.org/10.1016/j.jfueco.2024.100125.
2.
Banister David 2018. „The sustainable mobility
paradigm”. Transport Policy 15(2): 73-80. ISSN: 0967-070X. DOI: https://doi.org/10.1016/j.tranpol.2007.10.005.
3.
Elassy Mohamed, Mohamed Al-Hattab, Maen Takruri, Sufian
Badawi. 2024. „Intelligent transportation systems for sustainable smart
cities”. Transportation Engineering 16:1-18. ISSN: 2666-691X. DOI: https://doi.org/10.1016/j.treng.2024.100252.
4.
Zhao
Hongduo, Difei Wu. 2015. „Definition,
Function, and Framework Construction of a Smart Road”. In: New Frontiers in Road and Airport Engineering, edited by Lijun Sun, Jianming Ling, Hongduo Zhao,
Feipeng Xiao, Baoshan Huang, 204-218. Reston, Virginia: American Society of
Civil Engineers (ASCE). ISBN: 9780784479483.
5.
Angelidou Margarita, Christos Politis, Anastasia Panori,
Thomas Bakratsas, Katharina Fellnhofer. 2022. „Emerging smart city,
transport and energy trends in urban settings: Results of a pan-European
foresight exercise with 120 experts”. Technological Forecasting and Social
Change 183: 1-17. ISSN: 0040-1625. DOI: https://doi.org/10.1016/j.techfore.2022.121915.
6.
Dingil
Ali Enes. 2025. „Fostering inclusive urban transportation in planning and
policy-making: An umbrella review using ALARM methodology”. Sustainable
Futures 9: 1-10. ISSN: 2666-1888. DOI: https://doi.org/10.1016/j.sftr.2024.100420.
7.
Tafida
Adamu, Alaloul Wesam Salah, Zawawi Noor Amila Bt Wan, Musarat Muhammad Ali,
Abubakar Adamu Sani. 2024. „A Re-view
of Eco-Friendly Road Infrastructure Innovations for Sustainable
Transportation”. Infrastructures, 9(12): 1-43. ISSN 2412-3811. DOI: https://doi.org/10.3390/infrastructures9120216
8.
Burlacu Alina Florentina, Emily Tan. 2022. „How Do Best
Performing Countries in Road Safety Save Lives on the Roads? Lessons Learned
from Case Studies in Singapore”. In: Advances in Road
Infrastructure and Mobility. IRF 2021. Sustainable Civil Infrastructures, edited by Akhnoukh Amin, Kaloush Kamil, Elabyad Magid, Halleman Brendan, Erian Nihal, Enmon
II Samuel, Henry Cherylyn, 117-133. Switzerland: Springer. ISBN: 3030798011.
9.
Pompigna Andrea, Raffaele Mauro. 2022. „Smart
Roads: A State of the Art of Highways Innovations in the Smart Age”. Engineering
Science and Technology. An International Journal 25: 1-15. ISSN: 2215-0986. DOI: https://doi.org/10.1016/j.jestch.2021.04.005.
10.
Yusuf Syed Adnan, Arshad Khan, Riad Souissi. 2024.
„Vehicle-to-everything (V2X) in the autonomous ve-hicles domain – A technical
review of communication, sensor, and AI technologies for road user safety”. Transportation
Research Interdisciplinary Perspectives 23:1-23. ISSN: 2590-1982. DOI: https://doi.org/10.1016/j.trip.2023.100980.
11.
Zare Nazanin, Elzbieta Macioszek, Anna Granà, Tullio
Giuffrè. 2024. „Blending
Efficiency and Resilience in the Performance Assessment of Urban Intersections:
A Novel Heuristic Informed by Literature Review”. Sustainability
16(6):1-24. ISSN: 2071-1050. DOI: https://doi.org/10.3390/su16062450.
12.
Guo Mingyuan, Sepani Senaratne, Laura Almeida, Srinath
Perera. 2024. „Towards
Circularity in Roads Infrastructure: A Critical Review”. In: Circular Economy for Buildings
and Infrastructure. Sustainable Development Goals Series, edited by Zuo Jian, Shen
Liyin, Chang Ruidong, 319-331. Cham, Switzerland: Springer. ISBN: 978-3-031-56240-2.
13.
Directorate-General
for Mobility and Transport. „The official portal for European data”. Available
at: https://data.europa.eu/data/datasets/eu-transport-in-figures-2020?locale=en.
14.
ISTAT. „Indicators of the Vehicle Fleet”. Available at: https://www.istat.it/comunicato-stampa/indicatori-del-parco-veicolare-anno-2023/.
15.
ISTAT. „Environmental data in cities”. Available at: https://www.istat.it/informazioni-sulla-rilevazione/dati-ambientali/.
16.
Berrada
Jaâfar, Hassan Mahdavi S.M., Romina Quaranta, Paola Rodríguez, Victor Ferran, Jenny
Weidenauer. 2025. „Driving the Future: Unveiling Innovative
Business Models for Shared Automated Mobility Services”. In: Shared Mobility Revolution. Lecture Notes in Mobility, edited by Cornet Henriette, Gkemou M aria, 199-214.
Cham, Switzerland: Springer. ISBN: 978-3-031-71792-5.
17.
Ting Hua
Ting, Lee Lai Soon, Stefan Pickl, Hsin-Vonn Seow. 2021. „Shared
Mobility Problems: A Systematic Review on Types, Variants, Characteristics, and
Solution Approaches”. Appl. Sci. 11(17): 1-42. ISSN: 2076-3417. DOI: https://doi.org/10.3390/app11177996.
18.
Narayanan
Santhanakrishnan, Constantinos Antoniou. 2023. „Shared mobility services towards Mobility as a Service
(MaaS): What, who and when?”. Transportation Research Part A: Policy and
Practice 168: 1-15. ISSN:
1879-2375. DOI: https://doi.org/10.1016/j.tra.2023.103581.
19.
National
Observatory on Sharing Mobility. „8th National Report on Shared Mobility”.
Available at: https://osservatoriosharingmobility.it/.
20.
Morimoto
Akinori, Ailin Wang, Nahoiro Kitano. 2022. „A conceptual framework for road
traffic safety considering differences in traffic culture through international
comparison”. IATSS Research 46(1): 3-13. ISSN: 0386-1112. DOI: https://doi.org/10.1016/j.iatssr.2021.11.012.
21.
European
Commission. „Road safety policy framework 2021-2030”. Available at: https://www.europarl.europa.eu/doceo/document/TA-9-2021-0407_EN.html.
22.
ISTAT. „Road crashes in Italy”. Available at: https://www.istat.it/tag/incidenti-stradali/.
23.
ISTAT. „Resident population”. Available at: https://demo.istat.it/.
Received 30.06.2025; accepted in revised form 10.09.2025
![]()
Scientific Journal of Silesian
University of Technology. Series Transport is licensed under a Creative
Commons Attribution 4.0 International License