Article
citation information:
Al
Hasanat, H., Alharasees, O., Alshamaileh,
L. Evaluation of vehicle lateral positioning for lane-keeping performance
across multiple sites. Scientific Journal
of Silesian University of Technology. Series Transport. 2025, 129, 5-25. ISSN: 0209-3324. DOI: https://doi.org/10.20858/sjsutst.2025.129.1
Haitham AL HASANAT[1],
Omar ALHARASEES[2], Lafee ALSHAMAILEH[3]
EVALUATION OF
VEHICLE LATERAL POSITIONING FOR
LANE-KEEPING PERFORMANCE ACROSS MULTIPLE SITES
Summary. This study investigates
lateral lane-keeping behavior among human-driven
passenger vehicles on Jordanian multi-lane roads. Using overhead video footage
collected at five sites, 500 vehicles traveling alone in the leftmost lane
under free-flow, daylight conditions were manually annotated for centerline deviation. The lateral position was analyzed using descriptive statistics, temporal trends, and
spectral frequency analysis. Results show that 61% to 83% of vehicles remained
within a ±0.5 m “safe zone” from the lane center.
No vehicle exceeded the ±1.75 m legal lane boundary, and wheel position
plots confirmed consistent lateral margins. Sites 1 and 2 exhibited a slight
rightward bias, while Sites 3 through 5 showed a leftward tendency, especially
Site 3, which had the highest variability (std dev = 0.43 m). Spectral
analysis revealed consistent low-frequency oscillations (~0.01-0.02 Hz),
indicating slow, smooth steering adjustments with no erratic corrections. The
study confirms that under ideal conditions, drivers maintain stable lateral
control within 3.5 m lane widths. These results provide valuable
reference data for autonomous vehicle calibration, infrastructure planning, and
future research into lane-keeping behavior under
variable traffic and environmental conditions.
Keywords: lateral position, lane-keeping, autonomous vehicles, vehicle stability,
lane departure, driving behavior patterns
1. INTRODUCTION
Maintaining
strict lateral vehicle alignment is a critical parameter in roadway design and
operational safety. Minor within-lane deviations may elevate collision
likelihood, disrupt capacity, and reduce driver predictability. Among the
governing variables influencing lateral trajectory is lane width. Broader lanes
offer spatial freedom but tend to reduce steering precision and attentional
focus. Narrow lanes restrict maneuverability,
promoting centralized driving alignment. This relationship has been rigorously
examined through naturalistic traffic observations, simulator environments,
sensor-instrumented vehicles, and overhead video datasets. Pan et al. (2025)
identified that excessive lane width undermines drivers' lane-centering sensitivity, increasing lateral drift
susceptibility
In
Jordan, these principles take on added urgency. The nation has witnessed an
alarming surge in traffic incidents, with reported crashes increasing from
122,970 in 2020 to 190,175 in 2024, leading to 543 recorded deaths and over
18,000 injuries in that year alone
Urban
expansion in Amman continues to outpace infrastructure adaptation. From 2020 to
2024, vehicle registrations grew from 1.72 to nearly 2.0 million units, placing
exceptional demand on a network originally designed for lower volumes
Despite
the growing awareness, Jordanian road safety research has not kept pace with
infrastructure development. National accident reports provide aggregate
figures, but little empirical data exist on how drivers actually position their
vehicles laterally during everyday travel. Current assessments rely heavily on
crash post-analysis and police records, lacking direct measurement of
lane-level behavior. This represents a serious
knowledge gap, particularly as lane-related violations remain one of the most common
causes of accidents. Amman’s mixed roadway system – comprising high-speed
corridors, urban arterials, and substandard local roads – presents a complex
and understudied setting for analyzing lateral
positioning under varied geometric and operational conditions. Addressing this
gap requires reliable, site-specific data on how real drivers respond to lane
width, shoulder presence, and road alignment across different segments of the
city’s transport network.
The
present study provides an empirical investigation of lane-keeping performance
across multiple road sites in Amman under ideal free-flow, daylight conditions.
By capturing overhead video footage and manually annotating vehicle centerline deviations for a sample of 500 passenger cars,
the study quantifies the magnitude, direction, and variability of lateral
positioning. Statistical, temporal, and frequency-domain analyses are used to
evaluate lane centering stability. While the
structure of this work mirrors existing international methods, its application
in Amman offers an original contribution. No prior study has generated
detailed, high-resolution lateral control data from Jordanian roadways. As
such, the findings establish a baseline reference for driver behavior under standard geometric conditions and offer
practical implications for lane width policy, design standards, and automated
vehicle system calibration. The study’s novelty lies in its methodological
adaptation to a Jordanian urban context and its role in bridging the empirical
gap in regional transport safety literature.
2. LITERATURE REVIEW
2.1 Lane width and lateral behavior
Lane
width critically governs lateral vehicle dynamics. A percentile analysis
established effective operational widths at 3.2 m (95th), 3.0 m
(90th), and 2.8 m (85th), reflecting how spatial constraint sharpens lane
discipline across urban corridors
2.2 Effects of lane position and road
geometry
Lane
position significantly influences lateral stability. Simulator studies on urban
expressways show that outer-lane drivers maintain an inward offset of
0.20-0.30 m to avoid close barriers, especially when lane widths are
2.85-3.00 m and shoulders are only 0.50 m wide
2.3 Methodologies: simulators vs
field data
Driving
behavior is studied using two main methods:
simulations and field data. Simulations allow controlled changes, such as lane
width or shoulder type. Field studies capture real-world behavior
under natural conditions. Simulations offer control; field data offer realism.
Both are essential for a full understanding of road safety.
Field
data consistently show that narrower lanes raise lateral deviation and crash
risk. On Italian mountain roads, 3.0-3.2 m lanes caused 30% more lateral
wandering and 8% lower speed than 3.5 m lanes
By
contrast, naturalistic and instrumented-vehicle studies capture real driving in
traffic. Like using UAV video on freeways to measure vehicles’ lateral
distances during overtakes
2.4 Global and regional perspectives
Road
authorities worldwide recognize lane width as a crucial design parameter. In
the United States, the AASHTO Green Book mandates 3.66 m lanes on
high-speed roadways, while urban arterials may utilize 2.7-3.6 m widths
depending on context
Field
research in Sweden has measured lateral positioning on two-lane rural roads,
finding standard deviation of lateral wander between 0.19-0.46 m,
depending on lane width and roadside design
2.5 Knowledge gaps and research needs
Although
the relationship between lane width, speed, and lateral control is
well-established, several critical gaps remain. First, most existing research
neglects the impact of mixed traffic conditions, particularly the interaction
of motorcycles, cyclists, and passenger cars in congested urban settings. How
these dynamics influence lateral behavior in narrow
lanes is insufficiently understood. Second, current evidence is largely drawn
from controlled simulation environments, which fail to capture real-world
variability in speed choice and lane-keeping. Naturalistic driving studies are
needed to examine how drivers simultaneously adjust speed and lateral position
across diverse road geometries.
Third,
regional variations in driving behavior are
underexplored. In cities like Amman, where informal lane discipline and high
traffic heterogeneity prevail, it remains unclear whether global findings on
lane width apply. There is a need for empirical studies grounded in Middle
Eastern contexts to test the generalizability of established design
assumptions.
Finally,
the impact of advanced driver-assistance systems (ADAS), particularly
lane-keeping assistance, under nonstandard lane widths and degraded markings
warrants investigation. As these technologies are increasingly deployed in
Jordan, understanding their compatibility with existing infrastructure is
essential.
Key research questions include:
·
How does
mixed traffic in urban centers like Amman affect the relationship between lane
width and lateral control?
·
To what
extent do speed and lane width interact under naturalistic driving conditions?
·
How
transferable are international findings to regional driving cultures?
·
How do
ADAS systems perform in narrow or irregular lanes commonly found in Amman?
3.
DATA
AND METHODOLOGY
3.1 Study site and data collection
This
study was conducted on selected segments of Jordanian roads, predominantly
featuring two or three lanes per direction, and a posted speed limit ranging
from 60-80km/h. These roads, which serve as interurban connectors, were chosen
for their representative geometric and traffic characteristics. Data collection
focused on straight, level road sections in order to eliminate confounding
effects from curvature, elevation changes, or merging zones.
Vehicle
observations were recorded using a fixed camera mounted orthogonally on an
overpass. Although the exact height of the bridge is not specified, it adheres
to standard clearance regulations designed to accommodate heavy vehicles. The
camera setup ensured minimal perspective distortion and provided a clear
top-down view of passing vehicles. The footage was captured during daylight
hours under clear weather conditions to maintain consistency in visibility and
lighting. Traffic was observed to be in free-flow conditions, with no signs of
congestion or abnormal vehicular interactions.
3.2 Sample selection and annotation
From
the collected video footage, a total of 500 human-driven passenger cars were
manually annotated. To ensure high precision and eliminate behavioral
artifacts, only vehicles traveling alone in the leftmost (fastest) lane were
included. Vehicles were excluded from the study if they were partially
obscured, in the process of changing lanes, or traveling adjacent to another
vehicle. This filtering process aimed to isolate undisturbed lane-keeping behavior under normal driving conditions.
Manual
annotation was carried out by a team of five trained observers. Each vehicle's
lateral position was recorded as the distance from the geometric center of the vehicle to the centerline
of the lane it occupied. While no formal camera calibration was applied, the
lateral offset was estimated visually, and values were averaged across
observers to reduce subjective bias. This approach yielded a practical estimate
of lateral position with an approximate accuracy tolerance informed by observer
consensus.
Kinovea motion
analysis software was employed to assist in the manual annotation process. The
software’s gridline overlay was activated to provide consistent spatial
referencing, with the spacing between consecutive gridline ticks calibrated to
represent 17.5 cm in the field. This ensured uniform measurement scaling across
all frames and enhanced the accuracy of lateral position estimation by allowing
observers to align vehicle features precisely relative to the lane centerline, as shown in Fig. 1.
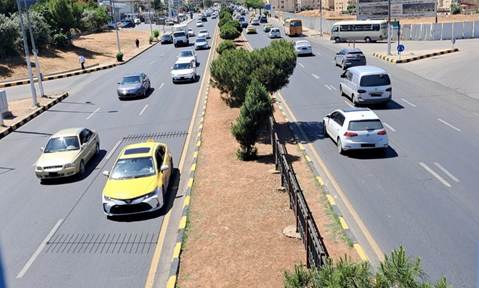
Fig. 1. Gridline overlay
in Kinovea showing 17.5 cm spacing between ticks for
lateral position measurement
3.3 Lane geometry
The
lane width was assumed to be 3.5 meters, based on national road design
guidelines and corroborated by official roadway documentation for the studied
road segments. Only the leftmost travel lane was considered for analysis to
reduce variability introduced by lane function as shown in Fig. 2.
3.4 Data processing and statistical
methods
The evaluation of lateral positioning data
followed a structured methodology to ensure accuracy, reproducibility, and
consistency with the study objectives (see Fig. 3). All analyses were conducted in Python using pandas
for data handling, numpy for numerical operations,
matplotlib and seaborn for visualization, and scipy
for basic statistical computations.
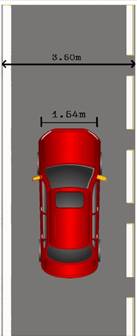
Fig. 2. Vehicle and lane
geometry reference for lateral positioning measurements
Data pre-processing
Annotated measurements from five independent
observers were compiled into a single dataset. For each vehicle, the lateral
offset from the lane centerline was averaged across
observers to reduce inter-rater variability. Only records meeting the
predefined criteria – human-driven passenger cars traveling alone in the
leftmost lane during daylight, under free-flow conditions, and without
occlusion or adjacent vehicles – were included. This filtering ensured the
dataset represented undisturbed lane-keeping behavior.
Descriptive statistical analysis
For each observation site, measures of central
tendency (mean, median) and dispersion (standard deviation, interquartile
range, minimum, maximum) were calculated. Distributional characteristics were
examined through histograms, boxplots, and kernel density estimates (KDEs) to
visualize lane-keeping behavior and identify
directional biases.
Safety and performance classification
Lateral
deviations were classified according to predefined thresholds:
·
Central Zone: within ±0.50 m of the lane
centerline,
·
Lateral Deviation Zones: left or right offsets
within lane boundaries (±1.75 m from the centerline).
The
proportion of vehicles in each category was computed to evaluate lane-keeping
accuracy.
Temporal analysis
To assess stability over the observation period,
deviations were plotted sequentially by vehicle index and smoothed using a
10-point rolling mean. This approach was used to detect potential drift or
changes in positioning behavior across the dataset.
Vehicle envelope analysis
Wheel positions were estimated by offsetting the
vehicle center position by ±0.75 m (half the assumed
vehicle width). These positions were compared with lane boundaries (±1.75 m
from the centerline) to evaluate spatial margins and
verify lane compliance.
Frequency-domain analysis
Lateral deviation time series were analyzed in the frequency domain using the Fast Fourier
Transform (FFT) to identify dominant oscillation frequencies and characterize
the periodicity of steering adjustments.
This combination of descriptive, temporal,
spatial, and spectral analyses provided a comprehensive basis for interpreting
lane-keeping performance across the observation sites.
Fig. 3. Flowchart
illustrating the sequential data processing and statistical analysis steps used
in the evaluation of vehicle lateral positioning
4.
RESULTS
This
section presents the lane-keeping performance of human-driven passenger
vehicles across five observation sites located on Jordanian multi-lane roads.
Each site was characterized by straight road geometry, standard 3.5-meter lane
widths, and consistent conditions (daytime, clear weather, free-flowing
traffic). Only vehicles traveling alone in the leftmost (fastest) lane were analyzed to isolate undisturbed lane-keeping behavior.
4.1 Lateral position summary
statistics
Descriptive
analysis was conducted to evaluate the distribution of vehicle centerline deviations from the lane center.
Tab.
1
summarizes the mean, standard deviation, and spread of lateral position across
all sites.
Tab. 1
Descriptive statistics of
lateral position deviation (in meters)
|
Site |
N |
Mean |
Std Dev |
Min |
25% |
Median |
75% |
Max |
|
1 |
100 |
+0.079 |
0.325 |
–0.750 |
–0.150 |
+0.050 |
+0.250 |
+0.750 |
|
2 |
100 |
+0.081 |
0.318 |
–0.740 |
–0.140 |
+0.055 |
+0.245 |
+0.740 |
|
3 |
100 |
–0.172 |
0.430 |
–0.850 |
–0.550 |
0.000 |
0.000 |
+0.750 |
|
4 |
100 |
–0.051 |
0.359 |
–0.850 |
–0.310 |
–0.030 |
+0.240 |
+0.630 |
|
5 |
100 |
–0.069 |
0.370 |
–0.850 |
–0.350 |
–0.040 |
+0.260 |
+0.630 |
Sites
1 and 2 showed a slight rightward deviation, while Sites 3, 4, and 5 revealed a
modest leftward bias. The standard deviation ranged between 0.318 and 0.430
meters, indicating relatively stable lane-keeping with some inter-site
variability. As shown in Fig. 4, the distributions of lateral position vary
modestly across sites. Sites 1 and 2 are slightly right-skewed, while Sites 3,
4, and 5 show a leftward shift, especially pronounced at Site 3.
|
|
|
(a) |
|
|
|
(b) |
|
|
|
(c) |
|
|
|
(d) |
|
|
|
(e) |
Fig. 4. Histograms and
kernel density estimates (KDEs) of vehicle lateral position deviation across
Sites 1 to 5
4.2 Lane-keeping accuracy and safety
The
percentage of vehicles that remained within a ±0.5 m deviation from the
lane centerline, referred to as the safe zones,
ranged from 61%-83% at all sites (see Tab.
2).
No
vehicles in any site crossed the lane boundaries (±1.75 m from the lane center), and all vehicles maintained both left and right
wheels within the legal lane limits.
Tab. 2
Lane-keeping
performance by site
|
Site |
Analysis Summary |
||||
|
Safe Zone Coverage |
Left Bias % |
Right Bias
% |
Lane Center % |
Lane Departure
% |
|
|
Site 1 |
83% |
53% |
29% |
18% |
0% |
|
Site 2 |
66% |
16% |
43% |
41% |
0% |
|
Site 3 |
61% |
8% |
58% |
34% |
0% |
|
Site 4 |
74% |
33% |
39% |
28% |
0% |
|
Site 5 |
74% |
22% |
42% |
36% |
0% |
Figure
5Fig.
5
presents boxplots comparing the central tendency and dispersion of lateral
deviation across all five sites. The figure confirms that median values were
close to zero at most sites, with greater variance observed at Site 3.
4.3 Distribution patterns and lateral
bias
Histograms
and kernel density estimates (KDE) revealed that:
·
Sites 1
and 2 had unimodal distributions centered slightly to the right of lane center
(positive deviation).
·
Sites 3
to 5 had distributions centered slightly to the left, with Site 3 showing the
widest spread and the clearest leftward skew.
Fig. 5. Boxplot of
lateral deviation across all five sites
These
findings are consistent with the descriptive statistics and suggest possible
influences from site-specific road geometry or driver behavior
tendencies. This pattern is further supported by the histograms and KDEs shown
in Fig. 4.
Fig. 4
4.4 Temporal consistency and rolling
averages
For
all sites, plots of lateral deviation over vehicle index showed no systematic
drift over time. Rolling mean plots indicated stable driving patterns
throughout the data collection sessions. This supports the reliability of the
observational protocol, and the uniformity of the traffic flow conditions
across all sites. As shown in Fig. 6, the rolling average of deviation over
vehicle index was consistent across time, with no drift or trending, indicating
data quality and driver consistency.
4.5 Vehicle wheel position vs. lane
boundaries
To
evaluate safety margins, the positions of the left and right wheels (inferred
from the center position ±0.75 m) were plotted
against lane boundaries. At no point did either wheel cross the lane edge, and
a comfortable margin from both boundaries was consistently observed, Fig. 7 visualizes
left and right wheel positions relative to the lane boundaries. All vehicles
stayed within ±1.75 m of the centerline, with no
contact or crossing of lane edges.
Fig. 6. Rolling average
of lateral position deviation across all vehicle indices at
Sites 1 through 5
|
|
|
(a) |
|
|
|
(b) |
|
|
|
(c) |
|
|
|
(d) |
|
|
|
(e) |
Fig. 7. Left and right
wheel positions relative to lane boundaries
(±1.75 m from lane centerline)
As
shown in Fig. 8. All sites demonstrated good lane-keeping, with over 60% of
vehicles within the ±0.5 m range.
Fig. 8. Proportion of
vehicles within the safe zone (±0.5 m from lane center)
across all sites
4.6 Frequency and stability analysis
Figure
9 displays the overlaid frequency spectra of lateral deviations for all five
sites. Across all sites, a dominant low-frequency component was observed near
0.01 to 0.02 Hz. This corresponds to slow, periodic lateral corrections
occurring approximately every 50 to 100 seconds. The consistent peak shape and
magnitude across sites suggest that drivers performed smooth, long-period
steering adjustments irrespective of location.
Notably,
Site 3 exhibited the highest amplitude near 0 Hz, indicating a larger average
deviation from the lane center and possible
persistent lateral offset. In contrast, Sites 1 and 2 displayed similar,
slightly lower peak magnitudes, confirming more centered
and stable driving behavior. The lack of
high-frequency components (>0.1 Hz) across all sites reflects the absence of
erratic or high-frequency corrections, underscoring the stable driving dynamics
under free-flow, ideal road conditions.
Fig. 9. Frequency
spectrum of lateral deviations across all five sites
5.
DISCUSSION
This
study presents an empirical evaluation of lane-keeping behavior
among human drivers under free-flow road conditions across five sites in
Jordan. The results reinforce the existing body of literature that indicates
drivers tend to maintain a reasonably centered
lateral position within standard lane widths, particularly under low-stress,
ideal conditions.
Descriptive
statistics showed that mean deviations were close to the lane center at most sites, ranging between +0.079 m and
–0.172 m. While Sites 1 and 2 exhibited a mild rightward bias, Sites 3
through 5 showed a modest leftward deviation, especially Site 3. This could
indicate subtle influences from site-specific features such as pavement marking
visibility, roadside geometry, or background scenery, which are known to affect
perceptual lane width and driver comfort. The increased spread in lateral
deviation at Site 3 (standard deviation of 0.43 m) further supports this
hypothesis.
Lane-keeping
accuracy was robust across all sites, with 61–83% of vehicles maintaining a
position within ±0.5 m from the lane center,
confirming good control under favorable conditions.
Notably, no vehicle at any site approached or crossed the lane boundaries, as
evidenced by wheel position plots and deviation limits. This finding affirms
that a 3.5 m lane width offers sufficient space for safe lateral maneuvering without over-constraining driver behavior.
Temporal
analysis showed no drift in mean deviation over time, suggesting stable behavior throughout the observation period and confirming
the reliability of the camera-based data collection method. Rolling averages
reinforced the consistency of vehicle tracking, even without formal
calibration. Additionally, the inferred wheel position analysis demonstrated
that vehicles consistently maintained a safe margin from lane boundaries.
Perhaps
most revealing was the frequency spectrum analysis. All five sites showed a
dominant peak in the 0.01-0.02 Hz range, corresponding to periodic
lateral shifts every 50 to 100 seconds. These slow, smooth oscillations suggest
that lateral deviations are primarily the result of subtle, infrequent
corrections rather than abrupt maneuvers. The uniform
spectral patterns across all sites, with low high-frequency content, provide
strong evidence of stable, attentive lane-keeping under ideal conditions. The elevated
zero-frequency amplitude at Site 3 further supports the notion of a persistent
leftward offset unique to that site.
Taken
together, these results demonstrate that under controlled, free-flowing
conditions, human drivers on Jordanian roads exhibit stable, centered lateral positioning with predictable correction
patterns. The combined use of spatial distribution, temporal smoothing, and
spectral analysis offers a holistic view of driver behavior
and highlights the utility of low-cost, observational methods for road safety
assessment.
6.
IMPLICATIONS
OF THE STUDY
The
findings of this research offer several key implications for transportation
infrastructure, vehicle automation, driver modeling,
and traffic safety policy.
1)
Road
Design and Lane Width Standard
The
results confirm that under ideal driving conditions – free-flow traffic, dry
pavement, and daylight – passenger vehicles are consistently able to maintain
lateral positions well within ±0.5 m of the lane center.
No vehicle approached or exceeded the ±1.75 m lane boundaries. These
observations validate the adequacy of current road design standards that
prescribe 3.5 m lane widths for motorways. In space-constrained
environments, this data could support re-evaluation of lane width requirements,
particularly on low-speed or urban segments where narrower lanes may improve
multimodal accommodation without compromising safety.
2)
Human
Driver Behavior Modeling
The
consistent low-frequency oscillations (0.01-0.02 Hz) in lateral deviation
reflect natural, smooth steering adjustments by human drivers. These spectral
patterns can inform the calibration of microscopic traffic simulation tools,
which often lack empirical lateral dynamics inputs. Incorporating these metrics
– such as deviation amplitude, frequency, and temporal stability – would allow
for more accurate representation of human steering behavior
in virtual environments and traffic modeling
software.
3)
Autonomous
Vehicle (AV) and Advanced Driver Assistance System (ADAS) Calibration
The
study provides a benchmark for what constitutes stable human lane-keeping
performance. These benchmarks can be used to evaluate the lateral control
algorithms of AVs and ADAS-equipped vehicles. Lane-centering
systems that match or exceed human-level lateral deviation control and swaying
frequency would be considered safe and acceptable by behavioral
standards. Additionally, the results may guide the definition of warning
thresholds for lane departure systems.
4)
Real-Time
Roadway Monitoring and Safety Alerts
Given
that significant lateral instability was not observed in the study, any
deviation from these patterns – such as high-frequency swaying or lane edge
encroachment – may indicate driver impairment, distraction, or deteriorating
environmental conditions. These anomalies could be used in the future to
trigger infrastructure-based safety alerts or real-time monitoring systems
designed to detect at-risk driving behavior.
5)
Policy
and Risk Assessment Applications
By
establishing baseline lateral behavior under optimal
conditions, this study enables more informed traffic safety audits and risk
analyses. The absence of erratic deviations or boundary violations supports the
use of current design standards on modern roads but also provides a reference
against which behavior in adverse conditions (e.g.,
nighttime, congestion, rain) can be meaningfully compared.
6)
Methodological
Validation and Data Science Potential
Finally,
the study demonstrates the value of overhead camera systems and signal analysis
techniques for extracting and analyzing driver behavior in a non-intrusive, scalable way. This lays the
groundwork for broader applications of computer vision, traffic data analytics,
and behavioral modeling in
transportation research, including cross-national studies and longitudinal
safety assessments.
7.
CONCLUSION
This
study evaluated the lateral positioning behavior of
500 passenger vehicles across five road segments in Jordan. Through visual
annotations and advanced signal analysis, it was determined that the majority
of vehicles (61% to 83%) remained within a ±0.5 m range of the lane center. No instances of lane departure were recorded, and
both left and right wheel paths stayed comfortably within the ±1.75 m
lane boundaries.
The
analysis revealed subtle spatial biases, with Sites 1 and 2 showing mild
rightward deviation and Sites 3 to 5 showing a leftward tendency. Site 3 had
the highest variability, indicating potential local design or perceptual
influences. Spectral analysis confirmed that lateral adjustments occurred
smoothly and periodically, primarily around 0.01-0.02 Hz, and no rapid
corrective behaviors were observed.
These
findings affirm that a 3.5 m lane width is sufficient to support safe,
comfortable driving behavior under optimal
conditions. The results provide a valuable behavioral
benchmark for calibrating lane-keeping assistance systems, informing road
design policies, and guiding future studies that incorporate adverse
conditions, driver distraction, or mixed traffic.
8.
LIMITATIONS
AND FUTURE WORK
While
this study provides a detailed assessment of lateral vehicle behavior under ideal conditions, several limitations must
be acknowledged. First, the data collection was restricted to clear, dry
daylight periods and free-flowing traffic, which excludes the influence of
adverse environmental conditions (e.g., rain, fog, darkness) or traffic
congestion. These factors are known to affect both lane-keeping behavior and driver attentiveness and should be considered
in future evaluations.
Second,
the study focused exclusively on passenger vehicles traveling alone in the
leftmost lane. While this controlled for confounding influences such as
lane-changing, following distance, or side-by-side interactions, it also limits
the generalizability of the findings to multilane interactions or commercial
vehicles. The lateral dynamics of larger vehicles, such as trucks and buses,
are likely to differ due to width, driver visibility, and lane occupancy behavior.
Third,
the study relied on manually annotated video frames from fixed overhead
cameras. Although this method proved effective and repeatable, it may introduce
minor human error in annotation and limits the temporal resolution of vehicle
motion. Automated tracking systems with high-frequency data (e.g., LiDAR or
drone-based photogrammetry) could provide more continuous and precise position
data for dynamic movement analysis.
Additionally,
the study did not incorporate contextual information such as pavement markings,
roadside features, or visual obstructions—all of which may influence driver
lane perception. Nor did it assess driver demographics, vehicle type, or
automation level, which could affect behavior.
Future
research should address these gaps by:
·
Expanding
the dataset to include nighttime, inclement weather, and congested traffic
conditions;
·
Incorporating
commercial vehicles and mixed-traffic interactions;
·
Using
automated, high-resolution tracking tools for real-time analysis;
·
Examining
the impact of road geometry, signage, and lane markings on lateral control;
·
Comparing
human-driven behavior with assisted or autonomous lane-keeping systems;
·
Exploring
cross-cultural and geographic variations in lane-use behavior.
Such
extensions would support more robust modeling of
driver behavior and inform the design of inclusive,
adaptive transportation systems that reflect the diversity of road users and
operating environments.
References
1.
Pan C., Y. Zhang, H. Zhang, and J. Xu. 2025. “Lateral
Displacement and Distance of Vehicles in Freeway Overtaking Scenario Based on
Naturalistic Driving Data”. Applied Sciences 15(5): 2370. DOI: 10.3390/APP15052370.
2.
Haitham A.H., G. Schuchmann. 2022. “Relationship between Critical Gap and Certain
Geometrical Parameters in Roundabouts”. Periodica Polytechnica Civil Engineering 66(3): 922-929. DOI:
10.3311/PPCI.18628.
3.
Liu S., J. Wang, T. Fu. 2016. “Effects
of Lane Width, Lane Position and Edge Shoulder Width on Driving Behavior in
Underground Urban Expressways: A Driving Simulator Study”. International
Journal of Environmental Research and Public Health 13(10): 1010. DOI: 10.3390/IJERPH13101010.
4.
Al
Hasanat H.A., D. Alothman, O. AlHarasees. 2025. “Capacity
of Single-lane Roundabouts in Hungary”. Periodica Polytechnica Transportation Engineering 2025. DOI:
10.3311/PPTR.37534.
5.
“Traffic
accidents surge in 2024, resulting in 543 deaths, 18,275 injuries – HPC”. 2025. The Jordan Times.
Available at:
https://jordantimes.com/news/local/traffic-accidents-surge-2024-resulting-543-deaths-18275-injuries-%E2%80%94-hpc.
6.
Alharasees O., H.A. Al Hasanat, D. Alothman. 2024. “Public
Perception of Autonomous and Shared Autonomous Vehicles: Case Study of Amman”. 2024
2nd International Conference on Technology Innovation and Its Applications
(ICTIIA). 1-5, Sep.
2024. DOI: 10.1109/ICTIIA61827.2024.10761581.
7.
Alharasees O., H.A. Al Hasanat, R. Al-Matarneh. 2025. “A
Comprehensive Human Factors Approach to Pedestrian Accidents Analysis in Urban
Environments”. 2025
2nd International Conference on Advanced Innovations in Smart Cities, ICAISC
2025. DOI:
10.1109/ICAISC64594.2025.10959468.
8.
Al-Tammemi
B., et al. 2024. “Navigating
Road Traffic Accidents in Jordan: ARetrospective Exploration of the Health
andEconomic Impacts”. Cureus 16(5). DOI: 10.7759/cureus.60497.
9.
“Traffic
Department: Wrong Lane Usage Caused 29.3% of Road Fatalities in 2024”. 2024. Jordan News. Available at:
https://www.jordannews.jo/Section-109/News/Traffic-Department-Wrong-Lane-Usage-Caused-29-3-of-Road-Fatalities-in-2024-42943.
10.
DOS. “Population Estimates at the End of 2024”. Amman, Jan. 2025.
11.
“Jordan
Registered Motor Vehicles, 2005-2024”. CEIC Data. Available at:
https://www.ceicdata.com/en/indicator/jordan/motor-vehicle-registered.
12.
MOT. “Ministry of Transport Transport Sector Strategic Plan
(2024-2028)”. Amman, 2024.
13.
GAM. “Transport and Mobility Master Plan for Amman Final
Report”. Amman, Apr. 2010. Available:
http://www.ammanbrt.jo/Studies?l=en
14.
Jrew B., N. Hussein, R. Al-Kouz. 2018. “Management
of Multi-Lane Highways in Jordan (Case Study)”. Jordan
Journal of Civil Engineering 12(1).
15.
Msallam M. 2019. “Evaluation
and improvement in the level of service of multi-lane highways in Jordan”. Elektronički
časopis građevinskog fakulteta Osijek
10(18):71-81. DOI: 10.13167/2019.18.7.
16.
Jrew B.,
M. Msallam, E. Mosab Naser. 2010. “Analysis, Evaluation and Improvement the Level of
Service of Two-Lane Highways in Jordan (Case Study/Jordan)”.
17.
Shima H., et al. “A national investigation on the impacts of lane
width on traffic safety: narrowing travel lanes as an opportunity to promote
biking and pedestrian facilities within the existing roadway infrastructure”. Report. Nov.
2023.
18.
Liu J., Z. Guo, D. Shan, X. Liu. 2024. “Effective
lane width for cars considering lateral oscillation characteristics based on
high-precision field data”. International Journal of Transportation Science and
Technology16: 18-33. DOI: 10.1016/J.IJTST.2023.10.007.
19.
Al
Hasanat H., J. Juhasz. 2022. “The Influence of Circulating and Entering Flows on
Critical Gaps Value in Roundabouts”. International Journal For Traffic And Transport
Engineering 12(3). DOI: 10.7708/IJTTE2022.12(3).03.
20.
“Lane
Width - NACTO”. Available at:
https://nacto.org/publication/urban-street-design-guide/street-design-elements/lane-width/.
21.
Al
Hasanat H.A., J. Juhász. 2023. “Development of Empirical Models to Predict Gap
Acceptance Parameter Based on the Geometrical and Operational Parameters of
Different Roundabouts”. Periodica Polytechnica Civil Engineering 67(2): 349-356. DOI:
10.3311/PPCI.20883.
22.
Tang J., et al. 2024. “Study on
the Deviation Characteristics of Driving Trajectories for Autonomous Vehicles
and the Design of Dedicated Lane Widths”. Sustainability 16(21): 9155. DOI: 10.3390/SU16219155.
23.
Chen Z., S. Wu, Z. Dai, Z. Chen, C. Pan, J. Xu. 2024. “A study
of vehicle lateral position characteristics and passenger cars’ special lane
width on expressways”. Engineering Reports 6(4): p. e12753. DOI:
10.1002/ENG2.12753.
24.
Wu S.F., Z.W. Chen, G.F. Zhang, Q. Chen, J. Xu. 2023. “Investigation
on Trajectory Deviation and Lane Lateral Margin of Passenger Cars on Freeways
Based on Field Driving Data”. China Journal of Highway and Transport 36(5): 197-209. DOI: 10.19721/J.CNKI.1001-7372.2023.05.017.
25.
Milstead R., et al. 2011. “Procedures for Setting Advisory Speeds on Curves FHWA
Safety Program”. New Jersey, Jun. 2011. Available at: http://safety.fhwa.dot.gov.
26.
Ding R.,
C. Pan, Z. Dai, J. Xu. 2022. “Lateral Oscillation Characteristics of Vehicle
Trajectories on the Straight Sections of Freeways”. Applied
Sciences 12(22): 11498. DOI:
10.3390/APP122211498.
27.
Al
Hasanat H., G. Schuchmann. 2022. “Critical Gap in Roundabouts – A Short Comparison of
Estimation Methods”. Periodica
Polytechnica Transportation Engineering 50(3): 273-278. DOI:
10.3311/PPTR.18632.
28.
Han L., Z. Du. 2025. “Research status, challenges and trends of curve driving
safety: A bibliometric analysis and critical review”. Journal
of Traffic and Transportation Engineering 12(4): 723-751. DOI:
10.1016/J.JTTE.2024.04.010.
29.
Mecheri S., F. Rosey, R. Lobjois. 2017. “The
effects of lane width, shoulder width, and road cross-sectional reallocation on
drivers’ behavioral adaptations”. Accid Anal Prev
104: 65-73. DOI: 10.1016/J.AAP.2017.04.019.
30.
Azin B., R. Ewing, W. Yang, N.S. Promy, H.A. Kalantari, N.
Tabassum. 2025. “Urban
Arterial Lane Width Versus Speed and Crash Rates: A Comprehensive Study of Road
Safety”. Sustainability 17(2): 628. DOI:
10.3390/SU17020628.
31.
Pan C., Z. Dai, Y. Zhang, H. Zhang, M. Fan, J. Xu. 2025. “An
approach for accurately extracting vehicle trajectory from aerial videos based
on computer vision”. Measurement 242: 116212. DOI:
10.1016/J.MEASUREMENT.2024.116212.
32.
Chen Z., S. Wu, Z. Dai, Z. Chen, C. Pan, J. Xu. 2024. “A study
of vehicle lateral position characteristics and passenger cars’ special lane
width on expressways”. Engineering Reports 6(4). DOI: 10.1002/ENG2.12753.
33.
Das V.R., M. Jayashree, S. Rahul. 2016. “Lateral Placement of Vehicles on Horizontal Curves”. Transportation
Research Procedia 17: 43-51. DOI: 10.1016/J.TRPRO.2016.11.059.
34.
Al
Hasanat H.A., O. Alharasees, D. Alothman. 2024. “Connected
Automated Vehicles Entry Capacity on Roundabouts - Case Study Hungary”. Proceedings
- 2024 2nd International Conference on Technology Innovation and Its
Applications, ICTIIA 2024. DOI: 10.1109/ICTIIA61827.2024.10761405.
35.
Faiz R.U., N. Mashros, S.A. Hassan. 2022. “Speed
Behavior of Heterogeneous Traffic on Two-Lane Rural Roads in Malaysia”. Sustainability 14(23): 16144. DOI:
10.3390/SU142316144.
36.
Russo F., S. Fric, S.A. Biancardo, D. Gavran. 2015. “Driver
Speed Behavior on Circular Curves of Undivided Two-Lane Rural Roads”. Transp
Res Rec 2472: 117-128. DOI: 10.3141/2472-14.
37.
Dingus T.A., et al. 2016. “Driver
crash risk factors and prevalence evaluation using naturalistic driving data”. Proceedings
of the National Academy of Sciences of the United States of America 113(10): 2636-2641. DOI: 10.1073/pnas.1513271113.
38.
Hancock M.W., P. Secretary. 2013. “A Policy on Geometric Design of Highways and Streets”. 6th Edition, 2011 - November 2013 Errata. Washington, DC.
Available at: http://downloads.transportation.org/GDHS-6-Errata.pdf.
39.
Desmon S. 2023. “How
Narrower Traffic Lanes Could Help Reduce Crashes. Narrower streets with room for bike lanes and sidewalks
could pay dividends for health and safety”. Bloomberg School of Public Health. Available at:
https://publichealth.jhu.edu/2023/narrower-lanes-safer-streets?utm_source=chatgpt.com.
40.
“Narrow
roads. Bike-friendly communities”. Bicycle
Network. Available at:
https://bicyclenetwork.com.au/tips-resources/bike-friendly-communities/narrow-roads/.
41.
McGarvey T. 2016. “Vehicle
lateral position depending on road type and lane width : vehicle position
surveys carried out on the Swedish road network”. VTI Rapport.
Available at: https://urn.kb.se/resolve?urn=urn:nbn:se:vti:diva-10747.
Received 17.08.2025; accepted in revised form 28.10.2025
![]()
Scientific Journal of Silesian
University of Technology. Series Transport is licensed under a Creative
Commons Attribution 4.0 International License