Article
citation information:
Szczucka-Lasota, B., Węgrzyn,
T., Chen, F., Turoń, K. Monitoring the quality of liquid
fuels using spectroscopy methods - selection of a light source. Scientific Journal of Silesian University of
Technology. Series Transport. 2025, 127, 257-265.
ISSN: 0209-3324. DOI: https://doi.org/10.20858/sjsutst.2025.127.15
Bożena SZCZUCKA-LASOTA[1], Tomasz WĘGRZYN[2], Feng CHEN[3], Katarzyna TUROŃ[4]
MONITORING THE
QUALITY OF LIQUID FUELS USING SPECTROSCOPY METHODS – SELECTION OF A LIGHT
SOURCE
Summary. The aim of the article
is to develop a new measurement station for assessing the quality of liquid
fuels using light spectroscopy methods. Tests were carried out using various
light sources, transmittance and absorbance were determined, and sources for
liquid fuel tests were selected. Fuel samples were prepared. At the developed
stand, it was checked whether the developed measurement method is suitable for
determining the quality of liquid fuel. The novelty of the article is to show
that spectroscopy methods using appropriate light sources are a prospective
solution for determining the quality of liquid fuels during continuous
monitoring. The research was performed in laboratory conditions. The technology
requires development and adaptation to real conditions; the research conducted
is qualitative and not quantitative.
Keywords: liquid fuels, fuels quality; automotive
1. INTRODUCTION
By
adopting the Act of the August 26, 2006 on the monitoring and control of the
quality of liquid fuels, together with supplementary provisions, the Parliament
of the Republic of Poland implemented a fuel quality control system consistent
with the system operating in the European Union, which came into force in 2007.
The quality control system in force in the country is managed by the President.
The Office of Competition and Consumer Protection (UOKiK),
inspections are carried out by the Trade Inspection (IH), and the tested
parameters and their scopes are determined by regulations of the Minister of
Economy [1]. In general terms, the national system for quality control of
liquid fuels consists in controlling the quality parameters of fuels throughout
the entire supply chain, i.e., at every stage of their operation, i.e.,
ready-made fuels are tested at producers, intermediaries, wholesalers, and gas
stations. However, laboratory research methods are long-lasting. Therefore, new
methods are being sought to assess the quality of liquid fuels, enabling quick
feedback. A problem that has not yet been solved is the constant monitoring of
liquid fuels. Newly developed liquid fuel quality methods presented around the
world have a number of limitations. According to the data literature [2-11]:
• the
majority of methods still require downloading samples of laboratory fuels and
specialist apparatus;
• for
safety reasons, including the possibility of ignition, some methods cannot be
approved for the continuous monitoring of long-term stordf
fuels, e.g., the method using a fiber optic optrode system;
• measurement
sensors used in some methods interact with the fuel, reducing the operational
properties of the fuel, which significantly limits the possibility of using
them during long-term monitoring;
• modern
equipment used in some solutions is extensive and requires laboratory working
conditions, therefore its use to assess the quality of fuels at storage
stations is impossible or significantly difficult.
In
the article, it was decided to develop a model of a simplified station for
monitoring the quality of liquid fuels. The research is preliminary research
conducted as part of a research project.
1.1.
Development of a model station and principle of operation
First,
a station for spectrometric measurements in the range of UV-VIS-NIR radiation
was developed. The site presented in Fig. 1 consisted of:
from
a white light source (1), an optical fiber supplying
light to a quartz glass cuvette (3), in which samples of the tested fuel (4)
are placed. The optical fiber is coupled with an
optical system that converts the divergent beam coming from the optical fiber into a quasi-parallel (collimated) one. The diameter
of the outgoing beam is 5 mm.
After
passing through the fuel cuvette, the light enters the output fiber (5), an output fiber
arranged concentrically in relation to the axis of the input system. The
optical fiber introduces them to (6) a UV-VIS-NIR
spectrometer, with a measurement range of 200-1000 nm (Thorlabs, model CCS
200/M).
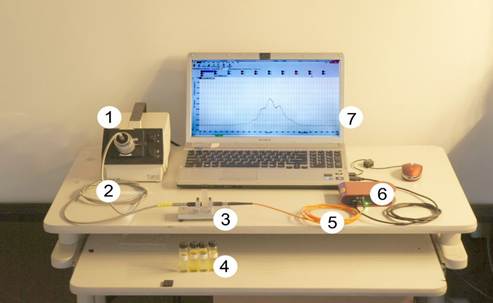
Fig. 1.
Station for preliminary measurements
Therefore,
the task of the output system is to focus a beam of parallel rays into the
optical fiber. Using a USB cable, the spectrometer is
connected to a computer (7) where the measurement results are saved in the form
of spectral spectra.
Due
to the fact that the system should operate in specific conditions, an important
step was to select the appropriate type of light source. Measurements of the
spectral spectra of selected light sources and their analysis are presented in
the next chapter.
2.
MEASUREMENTS OF SPECTRAL SPECTRA OF SELECTED LIGHT SOURCES
2.1. Selection
of light sources
For the first tests, a halogen lamp, a krypton lamp, a laboratory
illuminator with an optical fiber cutting off infrared radiation, a white RGB
LED, and a white LED with one chip were used. The choice of light sources was
dictated by practical considerations:
•
halogen and krypton
sources have a continuous spectrum in the VIS range, so if unusual changes
occur in this spectral range, they will be noticed. The disadvantage, from the
point of view of the target design, is the relatively low efficiency of
converting electric current into light,
•
therefore, sources
with low-power, high-efficiency, and many times higher durability, i.e.,
light-emitting diodes - LEDs, were also selected for testing.
2.2. Selection
of light sources
At
the presented research stand (Figure 1), spectral spectra of selected light
sources were measured. The results of the measurements carried out on the
preliminary test stand are presented in Figure 2.
Fig. 2.
Spectrum Analysis Chart for various light sources
At this stage
of design work, attention should be paid to:
•
the large
differences between the spectrum of a halogen lamp (blue graph) and the FLQ-150
halogen laboratory illuminator (green graph), shown in Figure 2. A clear
registered difference in the spectrum (for a halogen laboratory illuminator)
appears in the range above 600 nm and is caused by the use of optical fiber
attenuating infrared radiation. These types of optical fibers are used, for
example, in microscopy to examine biological preparations in order to cut off
infrared radiation, which could cause an unfavorable increase in the sample
temperature, which may also be important in the long-term process of monitoring
fuel quality.
•
on the
width of the obtained spectrum for a given lighting source. According to the
attached graphs, the halogen lamp (blue graph in Figure 2) and krypton lamp
(red graph in Figure 2) had the widest spectrum range.
•
characteristic
curve for the spectrum obtained using the LED-white_lW520A lamp, with a clear
maximum for a wavelength of approximately 460 nm.
Due
to the possibility of an unfavorable increase in the
sample temperature by a halogen lamp, a krypton lamp, characterized by the
widest spectrum, and a LED-white_lW520A lamp were used to carry out
measurements on the initial test samples of diesel fuel, for which
a characteristic course of the recorded curve was obtained in the wavelength
range of 400-500 nm.
2.3. Material
for research
The first
measurements were carried out on diesel oil samples (Table 1).
Tab.
1
Test samples
|
Symbol |
Characteristic |
|
HE |
ON- from the refinery
(delivered as "reference material"), FAME content below 0.5% v/v, |
|
HE/H |
diesel oil containing
more than 200 mg/kg of water |
|
ON/6/2 |
diesel oil containing
less than 0.5% v/v FAME from the storage tank from the middle layer, |
|
ON/H/6/2 |
diesel oil containing
approx. 7% v/v FAME from the storage tank in the middle layer, |
|
ON/H/B |
diesel oil containing
approx. 7% FAME, aged in a bomb from the induction period. |
Fifteen
samples of each material were prepared for testing. The results obtained were
similar for each material; therefore, only selected, representative test
results are presented in the next section.
3. FINDINGS
The results of the transmission spectra obtained and
recorded on the developed test stand using a krypton lamp are presented in Fig.
3. Preliminary analysis indicates that changes occur in the initial VIS range,
at the level of 400-500 nm and around 720 nm.
Fig. 3. Normalized transmission spectra of diesel fuel samples in the
light of a krypton lamp, sample markings in accordance with the text
Absorbance was also calculated in accordance with
those known from the literature. Figure 4 shows the results of the
appropriate conversions.
Based on the obtained measurement results, it can be
concluded that below 400 nm the signal coming from the source is very weak and,
therefore, it is characterized by high noise in the measured signal (Figure 4).
In the range from 400 to 500 nm, large changes in absorbance occur. Therefore,
this is the most characteristic range for the light source used - a krypton
lamp. The changes observed in the wavelength range above 500 nm are many times
smaller. Therefore, it was concluded that the analysis of the remaining scope
does not provide useful information.
Analogous
measurements were carried out using a light source in the form of a white LED –
LW-520A.
Fig. 4. Absorbance of diesel fuel samples in relation to a krypton lamp,
sample markings in accordance with the text
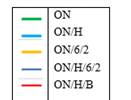
Fig. 5. Standardized transmission spectra of
diesel fuel samples in LED light,
sample markings in accordance with the text
The normalized transmission
spectra of diesel fuel samples in the light of the white LED – LW-520A are shown
in Figure 5. A clear recorded difference in the spectrum appears in the range
of 450 nm and in the range of approximately 580 nm. However, significant
changes in intensity were obtained for individual fuel samples only in the 450
nm peak area; in this area the recorded curves do not overlap, indicating
differences between the tested materials. Therefore, when assessing the quality
of liquid fuels using a light source in the form of a white LED - LW-520A, the
wavelength range between 400-500 nm should be taken into account for the
analysis of the quality of diesel fuels. The absorbance graph - Figure 6 -
shows clear differences recorded for individual samples of aged fuels.

Fig. 6. Absorbance of diesel fuel samples in LED
light,
sample markings according to the text
The differences are so
significant that they can be considered sufficient to analyze changes occurring
in the fuel. Comparison of the results for selected light sources allows us to
conclude that both light sources used in the tests provide information that can
be used to determine fuel quality, but more characteristic changes for the
tested fuel samples are recorded using a light source in the form of an LED
diode. Moreover, when using the white LED light - LW-520A, the electrical power
requirement was 96 mW, and in the case of the krypton
bulb used in the previous tests, the electrical power requirement was 6.75 W.
Therefore, the benefits of using it as LED light source. Additionally, LED
diodes, according to the manufacturer's data, are characterized by significant
durability, many times higher than the durability of other light sources.
4. SUMMARY AND
CONCLUSIONS
The analysis of the obtained measurement results
indicates that each diesel oil sample behaved differently than the others.
Analyzing the absorbance graphs presented in Figures 4 and 6, it can be seen
that individual samples reach a specific absorbance level for different
wavelengths. Therefore, a method can be used to determine the wavelength at
which the absorbance reaches a specific value. In this manner, the condition of the fuel that has been stored is easily
comprehensible.
Based on the measurement results obtained, it can be
concluded that:
1. The tested
LED sources have a more favorable spectral distribution, with the maximum
located in the range of 400-500 nm, where the greatest changes were observed
for the individual tested liquid materials,
2. Krypton
and halogen lamp light sources in the range of up to. 400 nm, due to the very
weak signal coming from the source and high noise in the measured signal, are
not sufficient to determine qualitative changes in the tested materials. The
sensitivity of the method using the analyzed light sources in the range of up
to 400 nm is insufficient.
3. Analysis
of the measurement range from 400 nm for a halogen lamp is not sufficient to
determine qualitative changes in fuel such as diesel oil because in the
above-mentioned range there are initially large changes in absorbance and then
many smaller changes,
4. When
LED light is used, sufficient information is obtained to analyze changes
occurring in diesel fuels due to much greater intensity changes in the 450 nm
peak area. The light emitted by the LED source can therefore be used to test
the quality of fuels, such as diesel oil.
5. The
tests were carried out independently on 50 samples, revealing and confirming
the observed relationship between the type of light source used and the type of
sample.
References
1.
The
Office of Competition and Consumer Protection. Report on the results of the
heating oil market research.
2.
Blaabjerg
Frede, Reme Teodorescu, Marco Liserre, Adrian Timbus. 2006. “Overview of
control and grid synchronization for distributed power generation systems”. IEEE
Transactions on Industrial Electronics 53(5): 1398-1409. ISSN: 1557-9948. DOI: https://doi.org/10.1109/TIE.2006.881997.
3.
Borecki Michał, Piotr Doroz, Jan Szmidt, Michael
Korwin-Pawlowski, Andrzej Kociubiński,
Mariusz Duk. 2013. “Sensing Method and Fiber Optic Capillary Sensor for
Testing the Quality of Biodiesel Fuel”. In: Sensordevices
2013: The Fourth International Conference on Sensor Device Technologies and
Applications: 19-24. IARIA Conferences, 27-31 August
2013, Barcelona, Spain. ISBN: 978-1-61208-297-4.
4.
Correia
M. Radigya, Eloilson Domingos, Vagne M. Cáo, Brenda R.F. Araujo, Sthefany Sena, Layla U. Pinheiro, André M. Fontes, Luiz Felipe M.
Aquino, Ernesto C. Ferreira, Paulo R. Filgueiras, Wanderson Romão. 2018.
“Portable near infrared spectroscopy applied to fuel quality control”. Talanta
176: 26-33. ISSN: 1873-3573. DOI: https://doi.org/10.1016/j.talanta.2017.07.094.
5.
Debe
Mark. 2012. “Electrocatalyst approaches and challenges for automotive fuel
cells”. Nature 286(7401): 43-51. ISSN: 1476-4687. DOI: https://doi.org/10.1038/nature11115.
6.
Ferrão
Marco Flôres, Mariela de Souza Viera, Rubén Edgardo Panta Pazos, Daniela
Fachini, Annelise Engel Gerbase, Luciano Marder. 2011. “Simultaneous
determination of quality parameters of biodiesel/diesel blends using HATR-FTIR
spectra and PLS, iPLS or siPLS regressions”. Fuel 90(2): 701-706. ISSN:
0016-2361. DOI: https://doi.org/10.1016/j.fuel.2010.09.016.
7.
Jiang Ke,
Ran Xing, Zhihan Luo, Wenxuan Huang, Fan Yi, Yatai Men, Nan Zhao, Zhaofeng
Chang, Jinfeng Zhao, Bo Pan, Guofeng Shen. 2024. “Pollutant emissions from
biomass burning: A review on emission characteristics, environmental impacts,
and research perspectives”. Particuology 85: 296-309. ISSN: 1674-2001.
DOI: https://doi.org/10.1016/j.partic.2023.07.012.
8.
Lack
Daniel, James Corbett. 2012. “Black carbon from ships: a review of the effects
of ship speed, fuel quality and exhaust gas scrubbing”. Atmospheric
Chemistry and Physics 12(9): 3509-3554. ISSN: 2002-9999. DOI: https://doi.org/10.5194/acp-12-3985-2012.
9.
Matijošius
Jonas, Edgar Sokolovskij. 2009. “Research into the quality of fuels and their
biocomponents”. Transportation 24(3): 212-217. ISSN: 1648-4142. DOI: https://doi.org/10.3846/1648-4142.2009.24.212-217.
10.
Sacha
Dariusz. 2020. “Impact of antioxidant additives on the stability of fuels for
diesel engines exposed to copper”. Nafta-Gaz 6:
419-426. ISSN: 0867-8871. DOI: https://doi.org/10.18668/NG.2020.06.07.
11.
Ukhanov
D.A., A.D. Cherepanova, A.P. Ukhanov, A.A. Khokhlov. 2022. “Thermo-oxidative
stability of diesel mixed fuel”.
Volga Region Farmland 1(12): 3003. ISSN: 2686-7672.
DOI: https://doi.org/10.36461/vrf.2022.12.1.006.
Received 19.10.2024; accepted in revised form 23.01.2025
![]()
Scientific Journal of Silesian
University of Technology. Series Transport is licensed under a Creative
Commons Attribution 4.0 International License