Article
citation information:
Golchin,
B., Raffi, M.A.B., Zakaria, N.Z., Abdullah, N.H. Pavement condition assessment using
lidar and ArcGIS: an experience from Malaysia. Scientific Journal of Silesian University of Technology. Series
Transport. 2025, 127, 73-85. ISSN:
0209-3324. DOI: https://doi.org/10.20858/sjsutst.2025.127.5
Babak GOLCHIN[1], Muhammad Aiman Badrish RAFFI[2], Nur Zarifah ZAKARIA[3], Noor Halizah ABDULLAH[4]
PAVEMENT CONDITION
ASSESSMENT USING LIDAR AND ARCGIS: AN EXPERIENCE FROM MALAYSIA
Summary. Pavements require
regular maintenance due to the wear and tear caused by traffic loads and
environmental conditions, which lead to various surface defects. This study
explores the use of Light Detection and Ranging (LiDAR) technology and ArcGIS
software to identify pavement defects in selected regions of Malaysia. The Jambatan Sultan Abdul Halim Muadzam
Shah Expressway (JSAHMSE) and the Guthrie Corridor Expressway (GCE) were chosen
as test sites for evaluating this approach. Initially, point cloud data were
collected from both expressways using LiDAR, and related images were processed
through ArcGIS software to identify defects on the road surfaces. The analysis
revealed defects such as shoving, bleeding, longitudinal cracking, potholes,
and patching on the GCE, while raveling, longitudinal
cracking, bleeding, and edge cracking were observed on the JSAHMSE.
Simultaneously, manual visual inspections were conducted, and defects were
documented. A comparison of the results from both methods showed that LiDAR and
ArcGIS effectively identified the types and sizes (length and surface area) of
the defects. However, ArcGIS struggled to accurately measure the depth of
certain defects, making it difficult to assess their severity in detail.
Keywords: pavement defects, LiDAR, Point cloud, ArcGIS software
1. INTRODUCTION
With technological advancements playing a vital
role in our lives, exploring new methods for road construction and maintenance
has become increasingly important. For example, Santosa et al. (2020)
introduced a low-cost, in-vehicle pavement distress inspection system that
utilizes semiautomatic data processing for airport pavement management [1].
This system significantly reduced both the time and costs associated with data
collection. Similarly, Wu et al. (2019) developed an innovative approach for
detecting road potholes using mobile point clouds and imaging [2]. Another
technology gaining traction in this field is LiDAR, which is being utilized for
data collection in road construction and maintenance. LiDAR uses pulsed laser
light to measure distances to the Earth, enabling the precise collection of
geometric and attribute information about various objects.
LiDAR technology operates similarly to radar
(radio detection and ranging), allowing for the mapping of Earth's topographic
features over large areas and the determination of elevation [3]. It uses
pulses of laser light to measure distances to target objects, creating
three-dimensional data by coordinating latitude, longitude, and elevation (x,
y, and z). Inside the LiDAR device, a spinning mirror continuously rotates
along its vertical axis to collect data. The time it takes for a laser pulse to
reach a target and bounce back to the scanner determines the distance between
the LiDAR device and the object. This process generates a 3D point cloud,
transforming scanned areas into detailed 3D models. LiDAR is significantly more
efficient and cost-effective than traditional survey methods. Data can be
collected through three methods: airborne, terrestrial, and mobile scanning.
Terrestrial laser scanners are mounted on tripods and gather data from a fixed
position, while mobile scanners can capture data while in motion. Airborne
scanning, also known as aerial terrestrial scanning, is carried out using
helicopters or fixed-wing aircraft, allowing for the coverage of large areas
quickly.
In recent years, many studies have explored the
use of LiDAR technology in various applications. Zalama
et al. (2011) demonstrated how effective LiDAR can be for identifying geometric
features like hills and holes [4]. Similarly, Fu et al. (2013) conducted
experiments showing that LiDAR can accurately detect features such as bumps and
holes [5]. Shamayleh and Khattak (2003) highlighted that LiDAR data could also
be used to capture specific elements of roadway inventories [6]. Yang (2018)
applied LiDAR to scan the surfaces of concrete slabs in pavements [7], while
Guo (2015) used the technology to map out road surface characteristics [8]. He
(2017) focused on the strengths of airborne LiDAR for collecting highway
inventory data, emphasizing its potential in large-scale projects [9]. Neupane
(2019) pointed out that mobile LiDAR has the potential to enhance both the
availability and quality of surface data [10], especially for extensive road
networks, by automating data collection. Li (2015) introduced an innovative
method for detecting roads using aerial LiDAR point clouds, adaptable to
variations in road network intensity data [11]. Additionally, Puente (2013)
compared the performance of mobile LiDAR with ground-coupled GPR (2.3-GHz
antenna), offering insights into the relative strengths of each approach [12].
Other researchers have explored various
innovative applications of LiDAR technology. Yadava et al. (2018) introduced an
automated technique using Mobile Laser Scanning (MLS) to estimate road width, centerlines, longitudinal slopes, and cross slopes [13].
Jung (2019) took a different approach by breaking down LiDAR data into smaller
sections using MLS and then converting it into a local coordinate system [14].
Martín-Jiménez (2018) focused on developing a method for analyzing
LiDAR data, testing it on three sections of Spanish roads [15]. Holgado-Barco
(2014), Yang (2013), and Kumar (2014) each proposed their own unique methods
for processing and analyzing LiDAR data [16-18]. DiazVilarina (2016) highlighted that mobile laser scanning
has been a reliable method for producing georeferenced point clouds and images,
offering accurate and realistic representations of the environment [19]. Zhang
(2019) developed an automated system for identifying and measuring road
markings using 3D laser scanning data, which was later tested on real-world 3D
data [20]. Yang (2018) emphasized the need for specialized software to support
road design, expansion, and asset management, aiming to enhance the accuracy
and effectiveness of road safety and management systems [21]. Saad and Tahar
(2019) outlined a four-step process for evaluating ruts and potholes using
LiDAR, covering site reconnaissance, data collection, data processing, and
analysis [22]. Meanwhile, Akgul (2017) applied Terrestrial LiDAR to measure the
rate of pavement deterioration due to changing weather conditions on forest
roads [23].
Currently, highway departments around the world
rely on pavement condition assessments to guide their maintenance efforts. In
Malaysia, traditional methods for evaluating road conditions are still widely
used, but they come with their challenges—they are costly, labor-intensive,
and time-consuming, relying heavily on on-site measurements and visual
inspections. These methods often only provide a limited view, with damage and
deterioration detected through qualitative observations. However, as Ganendra
(2018) points out, the precise terrain mapping capabilities of LiDAR have made
it a popular choice in Malaysia for a range of applications, from engineering
and infrastructure projects to environmental management, disaster response, and
natural resource management [24]. This study explores how LiDAR data can be
applied in road condition assessments, with a particular focus on identifying
pavement issues more efficiently across Malaysia.
2. METHODOLOGY
2.1. Study area
Two sections were chosen for this study: the Jambatan Sultan Abdul Halim Muadzam
Shah Expressway (JSAHMSE) and the Guthrie Corridor Expressway (GCE) in
Malaysia. These locations were selected to evaluate and implement the LiDAR
technology. Figure 1 provides actual images of both the GCE and JSAHMSE.
2.2. Instrument and Software
In this research, LiDAR technology was utilized
for data collection, while the Aeronautical Reconnaissance Coverage Geographic
Information System (ArcGIS) served as the platform for analyzing
the data. Developed by Esri, ArcGIS is a robust software for processing and
managing maps and geographic data. After the data was collected in formats such
as vector, raster, or LAS files, it was processed and visualized using ArcGIS
to provide insights into pavement conditions.
|
|
|
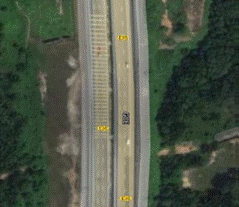
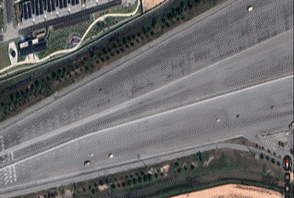
Fig. 1. Actual
image of GCE (left) and JSAHMSE (right)
2.3. Research Work
Figure 2 shows the flowchart of the research
plan. The process began by applying a rectangular grid to map the coordinates
of both expressways (see Figure 3). Next, road surface points were identified
using 3-dimensional point clouds. In the initial stage, the LAS data points
were divided into square grids of a predefined size. For each grid, planar
ground points were extracted, which then served as the basis for identifying
road points. A visual inspection of defects was carried out, and the necessary
data was recorded and analyzed. Figure 4 provides a
closer look at the LiDAR point clouds within the rectangular grid.
LAS data points are stored
in the X-Y-Z-I format, which is an industry-standard binary format for airborne
LiDAR data [25]. Here, XYZ represents the coordinates of each data point, while
"I" indicates its intensity or strength. To project these data points
onto a 2D plane, a rectangular grid is generated, grouping the data into a
two-dimensional square map. The first step involves creating the LAS dataset in
ArcGIS, which requires importing all relevant LiDAR data into a single, unified
dataset. This dataset includes the point clouds collected from the GCE and
JSAHMSE sections. Figure 5 offers a closer look at the 3D point clouds from
these areas. Once the LAS dataset is created, the grid structure that aligns
with the LiDAR data coordinates becomes visible.
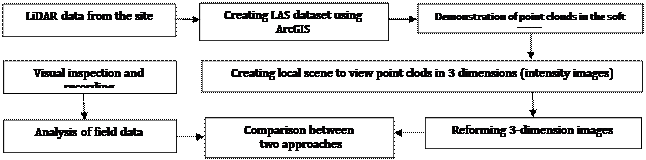
Fig. 2. Flow
chart of research
|
|
|
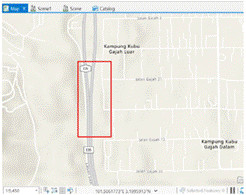
Fig. 3.
Rectangular grid of the LAS dataset created with corresponding XY coordinates
for GCE (left) and JSAHMSE (right)
|
|
|
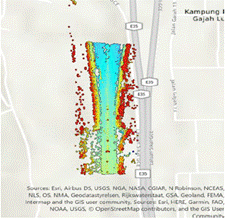
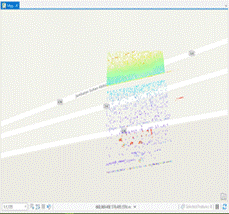
Fig. 4. A closer view of the LiDAR point clouds within the rectangular
grid at
the GCE (left) and JSAHMSE (right)
To visualize the point
clouds, a new local scene is created in ArcGIS (New Map > New Local Scene).
This 3D view allows for the identification of various elements within the
expressway, such as light poles, advertisement boards, road barriers, and vegetation.
The colors in the 3D model represent elevation
changes, with red indicating higher elevations and green indicating lower ones
(see Figure 6, left).
From these 3D
perspectives, changes in elevation and identified objects appear as clusters of
3D points. It’s worth noting that some objects detected on the expressway, like
moving vehicles, may not be fully captured, resulting in partial data points.
These can generally be disregarded when identifying road defects (see Figure 6,
right). Figure 7 shows the west-east and north-south cross-sections of the GCE,
providing a more detailed view of the data.
By analyzing
the road profile generated from the LiDAR data, pavement failures can be
identified by looking at the unevenness in the point clouds along the road
surface. Additionally, changing the LiDAR point symbology from elevation to
intensity images in the appearance tab of the LAS dataset layer makes these
defects even more visible. Since LiDAR data tends to be quite large, converting
it into intensity images helps to manage this bulkiness [26]. This conversion
enhances the clarity, making it easier to spot issues on the pavement. Figure 8
displays the intensity images derived from LiDAR points for the GCE.
|
|
|
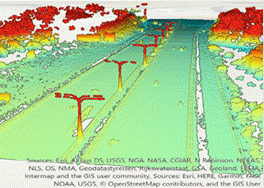
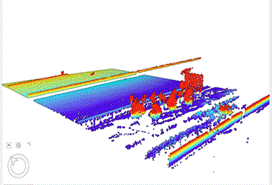
Fig 5. A
closer view of the 3D point clouds of the GCE (left) and JSAHMSE (right)
|
|
|
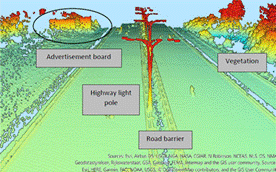
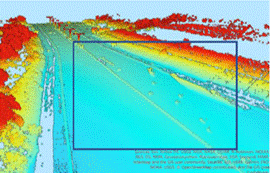
Fig. 6.
Inventories of the GCE (left) and example of unclarified objects assuming as
moving vehicles (Right)
|
|
|
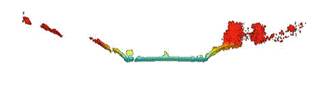
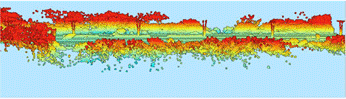
Fig. 7 The
west-east cross-section (left) and north-south cross-section (right) of the GCE
|
|
|
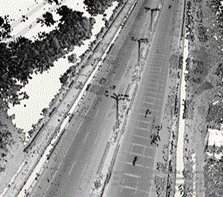
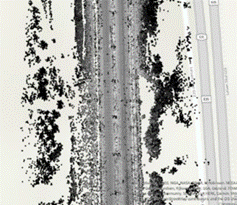
Fig. 8.
Intensity image for GCE
3. RESULT AND DISCUSSION
3.1. GCE pavement defects
In the selected
section of the GCE, shoving was observed at coordinates 101.5076887°E,
3.1980663°N. Shoving occurs due to shear forces created by traffic, especially
from vehicles that frequently start and stop. This results in the pavement
surface shifting either longitudinally or transversely [27]. Other contributing
factors include an unstable Hot Mix Asphalt (HMA) layer and excessive moisture
in the subgrade. In this specific section, the shoving failure measures
approximately 2.01 meters in length, 2.53 meters in width, covering a total area
of 5.09 square meters (see Figure 9).
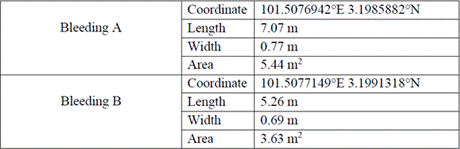
Bleeding on the
pavement surface is characterized by a shiny, glass-like appearance (see Figure
9). In the images generated by ArcGIS, this type of failure appears as watery
or paint-like patches scattered unevenly along a single wheel path. Two
instances of bleeding were identified on the left lane of the analyzed expressway section, as shown in Table 1. Severe
bleeding can pose a safety risk, as it may cause vehicles to skid when the
surface is wet, leading to a loss of traction and control.
Tab. 1
Bleeding
failures identified on the pavement at GCE
Longitudinal cracking
refers to a type of crack that runs parallel to the pavement’s centerline or laydown direction. Based on the software
analysis, this failure was identified as longitudinal cracking, as it appears
directly along the vehicle wheel path. The crack in this section is located in
the left lane and measures approximately 16.01 meters in length (see Figure 9).
It extends from coordinates 101.5073871°E, 3.2019300°N to 101.5073904°E,
3.2017888°N.
Potholes form when a
shallow, bowl-shaped depression develops in the pavement, extending from the
asphalt layer down to the base course. They typically appear because of
pavement fatigue, which leads to interlocking cracks, often referred to as
alligator cracking [28]. According to the ArcGIS analysis, a pothole was
identified in the left lane of the expressway, measuring approximately 0.80
meters in length, 1.35 meters in width, and covering an area of 1.08 square
meters. Its location is pinpointed at coordinates 101.5072856°E, 3.2014945°N
(see Figure 9).
The analysis revealed
that the GCE section contains several patches of varying sizes, from small to
large (see Figure 9). Table 2 highlights the patched areas identified on the
pavement surface. Patching involves replacing and covering sections of pavement
to repair earlier damage. While it addresses some issues, patching can also
create uneven surfaces, leading to discomfort for road users due to increased
roughness. Despite being a common repair method, patching is still classified
as a type of road failure.
|
|
|
|
Shoving |
Bleeding |
|
|
|
|
Longitudinal cracking |
Pothole |
|
|
|
|
Small Patches |
Large patches |
|
|
|
|
Raveling |
Longitudinal Cracking |
|
|
|
|
Pavement Bleeding |
Edge Cracking |
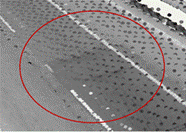
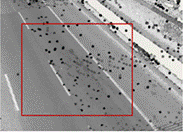
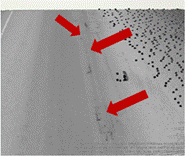
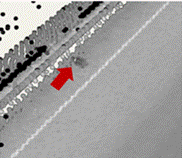
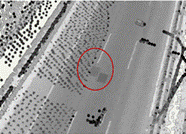
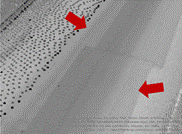
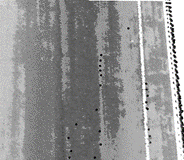
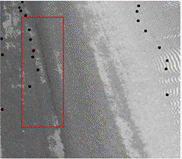
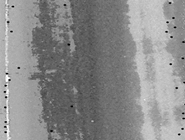
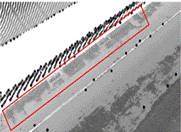
Fig. 9.
Generated images for pavement defects from LiDAR and ArcGIS
Tab. 2
Patching
identified on the pavement surface
|
Patching |
||
|
Coordinate |
Measurement |
|
|
101.5074605oE
3.2000009oN |
Length |
2.13 m |
|
Width |
1.38 m |
|
|
Area |
2.94 m2 |
|
|
101.5074645oE
3.1998100oN |
Length |
2.87 m |
|
Width |
1.25 m |
|
|
Area |
3.59 m2 |
|
|
101.5074986oE
3.1979002oN |
Length |
1.20 m |
|
Width |
1.12 m |
|
|
Area |
1.34 m2 |
|
|
101.5075081oE
3.1978964oN |
Length |
1.18 m |
|
Width |
1.02 m |
|
|
Area |
1.20 m2 |
|
|
101.5076563oE
3.1987019oN |
Length |
49.76 m |
|
Width |
3.65 m |
|
|
Area |
181.62 m2 |
|
|
101.5077685oE
3.2011483oN to 101.5076931oE
3.1974416oN (end section) |
Length |
408.74 m to (end section) |
|
Width |
10.12 m (start) 3.87 m (end) |
|
|
101.5078300oE
3.2019525oN to 101.5077785oE
3.2011474oN (end section) |
Length |
97.77 m to (end section) |
|
Width |
9.89 m (start) 10.35 m (end) |
|
Figure
9 shows the generated image of pavement raveling at
JSAHMSE from the point cloud data. Raveling can be
derived as a loss of fine and coarse aggregates from the asphalt matrix due to
the adhesion failure at the interface. From the generated image, the pavement
failure was measured, and it is 61.34 meters in length. The location of the
failure was identified and coordinated from (100.4512780°E 5.2332425°N) to
(100.4506732°E 5.2331457°N).
Figure 9 shows the generated image of
longitudinal cracking at JSAHMSE based on point cloud data. Longitudinal
cracking is a type of pavement distress that usually runs parallel to the edge
of the pavement shoulder. According to the image, this crack measures
approximately 9.75 meters in length, with its location pinpointed at
coordinates 100.4511358°E, 5.2332338°N.
Figure 9 shows the generated image of pavement
bleeding at JSAHMSE from point cloud data. However, the bleeding could also be
mistaken for pavement raveling, as the image lacks
clarity and the two types of damage appear similar. A more detailed inspection
is required to accurately determine the type of pavement failure.
Figure 9 shows the generated image of edge
cracking at JSAHMSE based on point cloud data. Edge cracking refers to cracks
that run parallel to the pavement’s edge, typically located 0.3 to 0.5 meters
away from the edge. In this case, the severity appears to be low, as the cracks
are shallow and do not result in significant breaks or material loss. The
affected area has already been repaired. Surface cracks are usually measured
using longitudinal profiles, with the affected area calculated by multiplying the
length of the defect by one meter. Defect density is then determined by
dividing the affected area by the total scanned section area and multiplying by
one hundred. However, in this study, the exact measurement of the failure could
not be determined due to the unclear quality of the generated image. A more
detailed site inspection is needed to accurately assess the extent and severity
of the cracking.
4. CONCLUSION
The process of analyzing LiDAR data to identify pavement failures using
ArcGIS software involves three main phases: combining all available LAS data
into a single dataset, creating a 3D view of the point clouds through a local
scene in ArcGIS, and conducting section analysis to identify failures.
1. The LiDAR point cloud data for both the GCE and
JSAHMSE were processed in ArcGIS, resulting in 2D and 3D images of the road
sections. These images allowed for the identification of various pavement
failures across the two expressways.
2. Using the 3D intensity images generated from the
ArcGIS software, several types of pavement failures were identified, including
shoving, bleeding, longitudinal cracking, potholes, patching, raveling, and edge cracking. Importantly, no critical or
severe failures were detected that would significantly impact driving comfort
on the GCE and JSAHMSE.
3. While the ArcGIS software successfully identified
and analyzed the length, width, and area of the
pavement failures, it faced challenges in accurately measuring the depth of
these defects. This limitation may be due to the minimal depth difference
between the surface and the base of the failures. Depth information is
especially critical for maintenance activities like repairing potholes, but
this could not be accurately captured with the software. Additionally,
determining the exact types of pavement failures can be difficult due to the
software’s inability to produce higher-intensity data from the LAS dataset,
leading to potential confusion between similar-looking defects. As a result,
the identified failures may not fully reflect the actual conditions of the GCE
and JSAHMSE sections.
4. Although the use of ArcGIS software for assessing
pavement conditions is not entirely precise, it offers significant time and
area coverage advantages, reducing the need for extensive on-site inspections.
However, on-site evaluations remain necessary for a complete and accurate
assessment of pavement conditions. Visual inspections of selected sections
demonstrated that LiDAR is an effective tool for identifying road surface
defects, making it a valuable method for pavement assessments.
References
1.
Santos
Bertha, Pedro G. Almeida, Ianca Feitosa, Débora Lima. 2020. "Validation of
an indirect data collection method to assess airport pavement condition." Case Studies in Construction Materials 13. ISSN: 2214-5095. DOI: https://doi.org/10.1016/j.cscm.2020.e00419.
2.
Wu
Hangbin, Lianbi Yao, Zeran Xu, Yayun Li, Xinran Ao, Qichao Chen, Zhengning Li, Bin Meng. 2019. "Road pothole extraction and
safety evaluation by integration of point cloud and images derived from mobile
mapping sensors." Advanced Engineering Informatics 42: 100936. ISSN: 1474-0346. DOI: https://doi.org/10.1016/j.aei.2019.100936.
3.
Chin
Abby. 2012. "Paving the way for terrestrial laser scanning assessment of
road quality." M.Sc. Thesis, Oregon State University.
4.
Zalama
Eduardo, Jaime Gómez‐García‐Bermejo, José Llamas, Roberto Medina.
2011. "An effective texture mapping approach for 3D models obtained from
laser scanner data to building documentation." Computer‐Aided Civil and Infrastructure Engineering 26(5): 381-392. ISSN: 1474-0346. DOI:
https://doi.org/10.1111/j.1467-8667.2010.00699.x.
5.
Fu
Pengcheng, Jeremy D. Lea, James N. Lee, John T. Harvey. 2013.
"Comprehensive evaluation of automated pavement condition survey service
providers' technical competence." International
Journal of Pavement Engineering 14(1):
36-49. ISSN: 1029-8436. DOI: https://doi.org/10.1080/10298436.2011.643794.
6.
Shamayleh
Huda, Aemal Khattak. 2003. "Utilization of LiDAR technology for highway
inventory." In: Proceedings of the 2003 Mid-Continent
Transportation Research Symposium. Ames,
Iowa.
7.
Yang
Shuo, Halil Ceylan, Kasthurirangan Gopalakrishnan, Sunghwan Kim, Peter C.
Taylor, Ahmad Alhasan. 2018. "Characterization of environmental loads
related concrete pavement deflection behavior using Light Detection and Ranging
technology." International Journal of Pavement Research and Technology 11(5): 470-480. ISSN: 1996-6814. DOI:
https://doi.org/10.1016/j.ijprt.2017.12.003.
8.
Guo
Jenny, Meng-Ju Tsai, Jen-Yu Han. 2015. "Automatic reconstruction of road
surface features by using terrestrial mobile lidar." Automation in Construction 58: 165-175. ISSN: 0926-5805. DOI:
https://doi.org/10.1016/j.autcon.2015.07.017.
9.
He Yi,
Ziqi Song, and Zhaocai Liu. 2017. "Updating highway asset inventory using
airborne LiDAR." Measurement 104: 132-141. ISSN: 1536-6359. DOI: https://doi.org/10.1016/j.measurement.2017.03.026.
10.
Neupane
Saurav R., Nasir G. Gharaibeh. 2019. "A heuristics-based method for
obtaining road surface type information from mobile lidar for use in
network-level infrastructure management." Measurement 131:
664-670. ISSN: 1536-6359. DOI: https://doi.org/10.1016/j.measurement.2018.09.015.
11.
Li Yong,
Bin Yong, Huayi Wu, Ru An, and Hanwei Xu. 2015. "Road detection from
airborne LiDAR point clouds adaptive for variability of intensity data." Optik
126(23): 4292-4298. ISSN: 0030-4026. DOI:
https://doi.org/10.1016/j.ijleo.2015.08.137.
12.
Puente
Iván, Mercedes Solla, Higinio González-Jorge, and Pedro Arias. 2013.
"Validation of mobile LiDAR surveying for measuring pavement layer
thicknesses and volumes." Ndt &
E International 60: 70-76. ISSN: 0963-8695 DOI: https://doi.org/10.1016/j.ndteint.2013.07.008.
13.
Yadav
Manohar, Ajai Kumar Singh, and Bharat Lohani. 2018. "Computation of road
geometry parameters using mobile LiDAR system." Remote Sensing Applications: Society and Environment 10: 18-23. ISSN: 23529385. DOI: https://doi.org/10.1016/j.rsase.2018.02.003.
14.
Jung
Jaehoon, Erzhuo Che, Michael J. Olsen, Christopher Parrish. 2019.
"Efficient and robust lane marking extraction from mobile lidar point
clouds." ISPRS journal of photogrammetry and remote sensing 147:
1-18. ISSN: 0924-2716. DOI: https://doi.org/10.1016/j.isprsjprs.2018.11.012.
15.
Martín-Jiménez
José Antonio, Santiago Zazo, José Juan Arranz Justel, Pablo Rodríguez-Gonzálvez, Diego González-Aguilera. 2018.
"Road safety evaluation through automatic extraction of road horizontal
alignments from Mobile LiDAR System and inductive reasoning based on a decision
tree." ISPRS journal of photogrammetry and remote sensing 146:
334-346. DOI: https://doi.org/10.1016/j.isprsjprs.2018.10.004.
16.
Holgado-Barco
Alberto, Diego Gonzalez-Aguilera, Pedro Arias-Sanchez, Joaquín Martinez-Sanchez. 2014. "An automated approach to
vertical road characterisation using mobile LiDAR systems: Longitudinal
profiles and cross-sections." ISPRS Journal of Photogrammetry and
Remote Sensing 96: 28-37. ISSN: 0924-2716.
DOI: https://doi.org/10.1016/j.isprsjprs.2014.06.017.
17.
Yang
Bisheng, Lina Fang, Jonathan Li. 2013. "Semi-automated extraction and
delineation of 3D roads of street scene from mobile laser scanning point
clouds." ISPRS Journal of Photogrammetry and Remote Sensing 79:
80-93. ISSN: 0924-2716. DOI: https://doi.org/10.1016/j.isprsjprs.2013.01.016.
18.
Kumar
Pankaj, Conor P. McElhinney, Paul Lewis, Timothy McCarthy. 2014.
"Automated road markings extraction from mobile laser scanning data."
International Journal of Applied Earth Observation and Geoinformation
32: 125-137. ISSN: 15698432. DOI: https://doi.org/10.1016/j.jag.2014.03.023.
19.
Díaz-Vilariño
L., H. González-Jorge, M. Bueno, P. Arias, I. Puente. 2016. "Automatic
classification of urban pavements using mobile LiDAR data and roughness
descriptors." Construction and Building Materials 102: 208-215. ISSN:
0950-0618. DOI: https://doi.org/10.1016/j.conbuildmat.2015.10.199.
20.
Zhang
Dejin, Xin Xu, Hong Lin, Rong Gui, Min Cao, Li He. 2019. "Automatic
road-marking detection and measurement from laser-scanning 3D profile
data." Automation in Construction 108: 102957. ISSN: 09265805 DOI: https://doi.org/10.1016/j.autcon.2019.102957
21.
Yang
Mengmeng, Youchuan Wan, Xianlin Liu, Jingzhong Xu, Zhanying Wei, Maolin Chen, Peng Sheng. 2018. "Laser data based automatic
recognition and maintenance of road markings from MLS system."Optics
& Laser Technology 107:
192-203. ISSN: 00303992. DOI: https://doi.org/10.1016/j.optlastec.2018.05.027.
22.
Saad Azri
Mat, Khairul Nizam Tahar. 2019. "Identification of rut and pothole by
using multirotor unmanned aerial vehicle (UAV)." Measurement 137:
647-654. ISSN: 1536-6359. DOI:
https://doi.org/10.1016/j.measurement.2019.01.093.
23.
Akgul
Mustafa, Huseyin Yurtseven, Serdar Akburak, Murat Demir, Hikmet Kerem
Cigizoglu, Tolga Ozturk, Mert Eksi, Anıl Orhan Akay. 2017. "Short
term monitoring of forest road pavement degradation using terrestrial laser
scanning." Measurement 103: 283-293. ISSN: 1536-6359. DOI:
https://doi.org/10.1016/j.measurement.2017.02.045.
24.
Ganendra
T.R., E.T. Mobarakeh, S.M. Khalid. 2018. "Technical challenges of airborne
LiDAR surveying technology in Malaysia." In: IOP Conference Series:
Earth and Environmental Science.
25.
ESRI.
(n.d.). What is a LAS dataset? ArcGIS Pro Documentation. Retrieved June 16,
2021. Available at: https://pro.arcgis.com.
26.
Husain
Arshad, Rakesh Chandra Vaishya. 2018. "Road surface and its center line
and boundary lines detection using terrestrial Lidar data." The
Egyptian Journal of Remote Sensing and Space Science 21(3): 363-374. ISSN:
1110-9823. DOI: https://doi.org/10.1016/j.ejrs.2017.12.005.
27.
Sorum
Neero Gumsar, Thangmuansang Guite, Nungleppam Martina. 2014. "Pavement
distress: a case study." International Journal of Innovative Research
in Science, Engineering and Technology 3(4): 274-284. ISSN: 2347-6710.
28.
Schnebele
E., Burak F. Tanyu, Guido Cervone, N.J. Waters. 2015. "Review of remote
sensing methodologies for pavement management and assessment." European Transport Research Review 7: 1-19. ISSN: 18668887. DOI: https://doi.org/10.1007/s12544-015-0156-6.
Received 22.03.2025; accepted in revised form 15.05.2025
![]()
Scientific Journal of Silesian
University of Technology. Series Transport is licensed under a Creative
Commons Attribution 4.0 International License