Article
citation information:
Sobota, A., Karoń, G., Żochowska,
R., Kłos, M.J. Methodology for research on traffic safety at signalized
intersections with countdown timers. Scientific
Journal of Silesian University of Technology. Series Transport. 2018, 100, 191-201. ISSN: 0209-3324. DOI: https://doi.org/10.20858/sjsutst.2018.100.16.
Aleksander SOBOTA[1], Grzegorz KAROŃ[2], Renata ŻOCHOWSKA[3],
Marcin Jacek KŁOS[4]
METHODOLOGY
FOR RESEARCH ON TRAFFIC SAFETY AT SIGNALIZED INTERSECTIONS WITH COUNTDOWN
TIMERS
Summary. The article is a
presentation of the authors‘ research work on determining the impact of
countdown timers on traffic conditions, and - in this case - on the level of
traffic safety at intersections. Therefore, the scientific aim of the article
is to present the methodology used by the authors to carry out research in
order to determine the influence of the function of the intersection with
countdown timers within an urban transportation network on the level of safety
at the intersection. To achieve the scientific objectives, measurements of
traffic at three intersections with different functions in a transportation
network have been performed.
Keywords: countdown timers;
traffic safety; signalized intersections; multilane intersections.
1. INTRODUCTION
The use of countdown
timers indicating the duration of individual signals at intersections with
traffic lights is not permitted in Poland because it is not in accordance with
[1]. However, the devices have been installed at some intersections in Polish
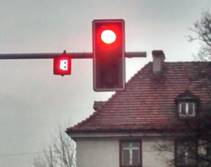
cities, such as Cracow, Wrocław, Opole and Zabrze. Figure 1 shows
photographs of existing equipment. In Figure 1a, the countdown timers at the
intersection of De Gaulle and Roosevelt Streets in Zabrze are presented and, in
Figure 1b, those at the intersection of Karkonoska and Zwycięska Streets
in Wrocław are shown.
In the opinion of
vehicle drivers and unprotected traffic participants, the use of countdown
timers helps to ensure safe passage through the intersection. This has been
proven by the research conducted by Kempa and Bebyn in Toruń [2]. Figure 2
illustrates the most important results of their survey conducted among vehicle
drivers.
Similar studies were
conducted in Bangkok on a sample of 300 drivers. More than 95% of these drivers
identified perceptible benefits arising from the functioning of countdown
timers, while it was also found that these results would encourage the Bangkok
authorities to install them [3].
|
a) |
b) |
![DSC00345[1]](191_SJSUTST100_2018_Sobota_Karon_Zochowska_Klos_pliki/image004.jpg)
Fig. 1. Examples of countdown
timers functioning at intersections in Poland
|
|
|
|
Green: yes, red: no, grey: I don’t care |
Green: yes, red: no, grey: I don’t care |
|
a)
Structure of the answers to the question: “Do the countdown timers help
you in safely passing through the intersection?” |
b)
The structure of the answers to the question: “Are drivers more
disciplined (fewer entries on the red signal are observed) when countdown
timers are functioning at the intersection?” |
Fig. 2. The results of the
survey carried out by Kempa and Bebyn
Source: [2]
Countdown timers are
engineering solutions that are also controversial, especially in terms of
ensuring an adequate level of traffic safety, as explained, for example, in [4-8]
and pedestrian safety [9].
These studies in Poland
focus on describing the defects of these devices, inter alia, in terms of
construction and photometric requirements. They also discuss the presumption
concerning the implications of the use of timers for dangerous behaviour of
vehicle drivers.
Foreign studies on the
functioning of countdown timers have been conducted, for example, in Kuala
Lumpur as well as in other cities in Malaysia. The studies examine the impact
of these devices on road safety and the assessment of their usefulness in terms
of improving traffic conditions [10]. The measure to be tested was the average
time interval between vehicles, which was about 10% shorter at intersections
with functioning counters. In turn, the analysis of road safety was based on
recording passes over the stop line at the red light with devices that were
switched both on and off. In the first case, 24 passes were registered in 88
signalling cycles, while, in the other, 22 passes occurred of out 90 cycles
(about three percentage points less) [10].
Other studies were
conducted in Bangkok, where countdown timers have been introduced on a large
scale (at about 400 intersections). Due to the long cycle times at most
intersections in the city, the main purpose of the installation of these
devices was to relieve the stress of drivers waiting for the green signal and
to minimize the delay caused by inattention while waiting for the signal to
change to green. The results of the research are summarized in [3], which
focuses, for example, on the relation between the lengths of queues with
countdown timers switched both on and off. This is also shown in Table 1.
Table
1
Lengths of queues at the intersection with countdown
timers switched on and off
|
State of
countdown timers |
Number of
registered cycles |
Cycle times
[s] |
Time of green
[s] |
Length of
queue [veh/230 s] |
|
On |
78 |
230 |
102 |
14-33 |
|
Off |
78 |
230 |
102 |
14-37 |
Source: [3]
The issue of the use of
the countdown timers has also been considered in [11-14]. However, it should be
noted that the results of the studies conducted in Asian countries may not be
comparable to those carried out in Europe due to the nature of the traffic.
2. INTERSECTION FUNCTION
AND THE TYPE OF TRAFFIC
In Poland, the function
of the intersection in transportation networks depends on the functions of the
crossing roads, which are determined both by the road categories and their
technical classes. Table 2 lists the categories of roads and their
corresponding technical classes according to [15].
Each technical road
class should comply with the relevant technical requirements (e.g., the minimum
lane width for Class A roads is 3.75 m, but, for Class D roads, it is 2.5 m),
which in turn define the functional requirements. In this way, the hierarchical
structure of the transportation network of the area is shaped. Therefore,
according to the authors, both the road and the intersection may be divided in
terms of functionality as follows:
-
roads
and intersections with non-urban traffic (most often national and voivodeship
roads with a high proportion of trucks and trucks with trailers)
-
roads
and intersections with urban traffic (most often district and municipal roads
characterized by a dominant and high share of passenger cars as well as
delivery trucks in traffic)
-
roads
and intersections with mixed traffic (mostly voivodeship and district roads
characterized by the presence of trucks, trucks with trailers and passenger
cars)
Table 2
Technical
classes and categories of roads in Poland
|
Category of
road |
Class of road |
|
National |
Class A -
motorways |
|
Class S - expressways |
|
|
Class GP - main roads of a higher standard |
|
|
Voivodeship/regional |
Class GP -
main roads of a higher standard |
|
Class G - main roads |
|
|
County/district |
Class GP -
main roads of a higher standard |
|
Class G - main roads |
|
|
Class Z - collector roads |
|
|
Communal/municipal |
Class GP -
main roads of a higher standard |
|
Class G - main roads |
|
|
Class Z - collector roads |
|
|
Class L - local roads |
|
|
Class D - access roads |
Source: [15]
It should be noted,
however, that the functionality of an infrastructure element may also be
assessed by analysing the structure of the network [16,17]. The identification
of infrastructure objects in terms of their functionality is presented in [18].
3. RESEARCH METHODOLOGY
AND CHARACTERISTICS
3.1. Methodology of the
study
In order to determine
the dependence between the function of the intersection in the transportation
network and the influence of the countdown timers used at Polish signalized
intersections on the traffic conditions, three research objects with different
types of traffic were selected. The estimation of the investigated dependence
consisted of traffic safety analyses at intersections with countdown timers
that were switched on and off. Therefore, the impact of the timers on the
number of passes over the stop line during the red signal was studied. The
measurements were carried out in two measuring periods with the devices
switched on and off. The studies were conducted for a total of 13 working days
between the hours of 07:00 and 19:00 for all objects.
Within the study, the
main recorded measures were:
-
the
moment of passing over the stop line by a driver travelling in a particular
direction in a certain lane when the red signal was displayed
-
the
moment of passing over the stop line by a driver travelling in a particular
direction in the certain lane when the yellow signal was displayed
At each intersection
these moments were recorded for the approach where the traffic was moving
towards the city centre.
For the purpose of
identifying the intersection function at the same time as the basic research,
additional measurements were also carried out for the following traffic
characteristics:
-
traffic
volumes in 5-min intervals
-
the
structure of traffic with respect to the direction, along with the accuracy of
the relation in the lane
-
the
structure of traffic based on the group of vehicles in 5-min intervals with the
following categories of vehicle: passenger cars (so), delivery trucks (sd),
microbuses (mi), trucks (sc), trucks with trailers (scp), buses (a),
articulated buses (ap), minibuses (mi), motorcycles (m), bicycles (r), other
(i)
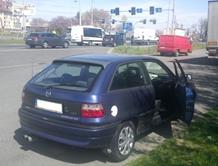
The characteristics of
traffic were recorded using a video camera and then analysed by the analysts
trained for this purpose. During the measurements, special attention was paid
to the placement of video cameras in order not to affect the behaviour of the
vehicle drivers. The cameras were set so that they were not visible to vehicle
drivers. Example photographs of the measurement sites are shown in Figure 3.
|
|
|
|
a) The measurement
site – car with a located camera |
b) The measurement
site – the camera in the car |
](191_SJSUTST100_2018_Sobota_Karon_Zochowska_Klos_pliki/image013.jpg)
Fig. 3. The measurement sites
The research sample for
all intersections totalled 233,392 pcu/312h. There were 116,696 pcu/156h in the
period when the countdown timers were switched on and 118,004 pcu/156h in the
period when the timers were switched off (i.e., 1,308 pcu/156h more).
3.2. Methodology of the
study
In the first stage of
the process of selecting the research objects, a group of intersections with
countdown timers installed, as well as with differentiated traffic structures
(and hence with different types of traffic), was chosen. This selection was
based on a map for the analysis of road categories. The final selection of
the objects for analysis (Stage 2) was determined by the measurements of
traffic, which were performed together with the analysis of its structure.
Thus, three
intersections were chosen and initially assigned their functional
characteristics, as shown in Table 3.
Table 3
Measurement points (intersections)
with a preliminary assessment of their functionality
|
City |
Names of
crossing roads |
Preliminary
functional classification of the intersection |
|
Zabrze |
De
Gaulle’a and Roosevelta |
Urban |
|
Opole |
Obrońców Stalingradu, Mieszka I and
Jagiellonów |
Mixed |
|
Wrocław |
Aleja Karkonoska, Zwycięska and
Jeździecka |
Non-urban |
The object in Zabrze was
a four-approach intersection, with two lanes at each approach. At the
intersection, a three-phase signal control is installed, which operates according
to four programs with fixed cycle lengths. This object has no additionally
separated right-turn lanes nor S-2 traffic signals, which display the signal
for turning in the direction indicated by the arrow. The intersection is about
1 km from the Diametrical Road Route (the voivodeship road), which is one of
the main connections between the cities in the Upper Silesian Agglomeration.
The object in Opole was
also a four-approach intersection. Obrońców Stalingradu Street,
which connects the city centre with Motorway A4, is Voivodeship Road no. 435,
while Jagiellonów and Mieszko I Streets are district roads. The traffic
is controlled by fixed time three-phase signalling. At the examined approach (Obrońców
Stalingradu towards the city centre), an additional traffic signal S-2 is
installed, but only in the lane for turning right.
The object located in
Wrocław was the largest of those selected for measurements. It is a
four-approach intersection with 12 lanes in total. There are three lanes at the
approach in which passes over the stop line during a red signal were examined.
Signalling at the intersection is based on four programs, which work according
to fixed schedules. The crossing streets are of district and commune
categories. The intersection is part of National Road no. 5 (E261), which connects
with Motorway A4 (located approximately 2 km from the highway).
4. DETERMINING THE FUNCTION OF THE
INTERSECTION ON THE BASIS OF OWN RESEARCH
To determine the
function of the intersection in the transportation network of the city, the
structure of traffic in terms of vehicle group at all examined approaches of
each of the intersections was analysed. Figures 4 to 6 show the structure of
vehicle groups throughout the entire measurement period, split into 5-min time
intervals. The vehicles identified during the study were aggregated into five
groups: car (C), delivery truck (DT), minibus (Mi), truck (T), bus (B), motor
and bike (MB).
Fig. 4. The structure of
vehicle groups at the intersection in Zabrze
Figure 4 shows the
distribution of the structure of vehicle groups at the intersection in Zabrze.
The minimum share of passenger cars in a single measurement interval (5 min)
was 82% and the maximum rate was 96%.
Figure 5 shows the
distribution of the structure of vehicles at the intersection in Opole. The
minimum share of passenger cars in a single measurement interval was 78%, while
the maximum rate was 90%.
Figure 6 shows the
distribution of the structure of vehicle groups recorded at the intersection in
Wrocław during measurements. The minimum share of passenger cars in a
single interval was 74%, while the maximum rate was 92%.
The average shares of
the particular groups of vehicles for the entire analysed period are presented
in Table 4.
Fig. 5. The structure of
vehicle groups at the intersection in Opole
Fig. 6. The structure of
vehicle groups at the intersection in Wrocław
Table 4
Average share of each group
of vehicles in [%]
for the entire analysed period
|
City |
Car |
Delivery truck |
Minibus |
Truck |
Bus |
Motor and bike |
|
Zabrze |
89.73 |
5.28 |
0.77 |
2.37 |
1.15 |
0.70 |
|
Opole |
84.25 |
6.33 |
2.04 |
4.51 |
1.57 |
1.30 |
|
Wrocław |
84.48 |
9.23 |
2.11 |
2.42 |
1.42 |
0.34 |
The largest average
share of passenger cars and the lowest average share of delivery trucks and
trucks among the analysed objects occurred at the intersection in Zabrze. In
turn, the object in Wrocław was characterized by the largest share of
delivery trucks and trucks, i.e., 11.65%. At the intersection in Opole, the
share of passenger cars was smaller than at the junction in Zabrze and similar
to the intersection in Wrocław. A smaller share of trucks was also observed,
compared to the intersection in Zabrze, as well as a smaller share of delivery
trucks and other trucks compared to the examined object in Wrocław.
5. CONCLUSIONS
The aim of the article
was to present the research methodology applied in order to perform
measurements for determining the influence of the use of countdown timers on
the level of traffic safety, depending on the function of the road intersection
in the transportation network. The methodology involved undertaking basic
research, which relied on the identification of the number of passes over the
stop line during the red signal, alongside additional studies, with the aim of
determining the function of the intersection based on the measurements of the
traffic volumes and the structure in terms of vehicle groups.
Before beginning the
basic research, the examined objects with countdown timers were selected and a
preliminary functional division of the intersections in terms of the type of
traffic (urban, mixed or non-urban) was made.
The results of the
studies on traffic volume and the structure of vehicle types validate the
assumed preliminary functional division of the examined intersections. For
example, at the intersection in Zabrze (mainly with urban traffic), the
passenger car share was dominant (over 89%), which was the largest rate in
comparison with other objects. At this intersection, the share of delivery
trucks and trucks was smaller than at the other intersections. The largest
share of these types of vehicles has been observed at the intersection in
Wrocław, i.e., at the one that was preliminary assumed as the intersection
with non-urban traffic. At the intersection in Opole, the share of passenger
cars was smaller than at the intersection in Zabrze and similar to the values
for the intersection in Wrocław, while the share of delivery trucks and
other trucks was larger than at the intersection in Zabrze and smaller than at
the intersection in Wrocław. These results confirm the correctness of the
initially assumed functional division of the intersections investigated by the
study.
During further research,
some new solutions for drivers should be considered. First of all, visual
information is critical in order to better understand transport system
solutions [19]. It is also vital to explore smarter planning on a global scale
[20] and the relation between drivers and autonomous vehicles [21].
References
1.
“Regulation
of the Minister of Infrastructure of 3 July 2003 on detailed technical
conditions for road signs and signals as well as traffic safety devices and
conditions for their placement on roads”. Journal of Laws 2003(220): item 2181.
2.
Kempa
Jan, Grzegorz Bebyn. 2014. “Countdown timers on traffic lights”. Logistyka 6: 5364-5370.
3.
Limanond
Thirayoot, Pramuk Prabjabok, Kraisi Tippayawong. 2010. “Exploring impacts
of countdown timers on traffic operations and driver behavior at a signalized
intersection in Bangkok”. Transport
Policy 17(6): 420-427.
4.
Kidwai
Farhan Ahmad, M.R. Karim, M.R. Ibrahim. 2005. “Traffic flow analysis of
digital count down signalized urban intersection”. In Proceedings of the Eastern Asia Society for
Transportation Studies 5: 1301-1308.
5.
Łazarczyk
S., Ł. Rządkowski. 2014. Raport
z badania wpływu licznika czasu zamontowanego przy sygnalizatorze na
bezpieczeństwo ruchu drogowego. [In Polish: Report
on the Impact of the Time Meter Mounted on Signals on Road Safety.]
Grudziądz, Poland.
6.
Jacyna
M. 1998. “Some aspects of multicriteria evaluation of traffic flow
distribution in a multimodal transport corridor”. Archives of Transport 10(1-2): 37-52.
7.
Kłodawski
M., R. Jachimowski, I. Jacyna-Gołda, M. Izdebski. 2018. “Simulation
analysis of order picking efficiency with congestion situations”. International Journal of Simulation
Modelling 17(3): 431-443. ISSN 1726-4529. DOI: 10.2507/IJSIMM17(3)438.
8.
Shekhar
Babu S., Vedagiri P. 2017. “Traffic conflict analysis of unsignalised
intersections under mixed traffic conditions”. European Transport/Trasporti Europei 66(10).
9.
Wanty
Dave Keith, S.M. Wilkie. 2010. Trialling Pedestrian Countdown Timers at
Traffic Signals. NZ Transport
Agency Research Report no. 428.
10.
Kidwai
Farhan Ahmad, M.R. Karim, M.R. Ibrahim. 2008. “The effect of digital
count-down display on signalized junction performance”. American Journal of Applied Sciences
5(5): 479.
11.
Chiou
Yu-Chiun, Chien-Hua Chang. 2010. “Driver responses to green and red
vehicular signal countdown displays: safety and efficiency aspects”. Accident Analysis & Prevention
42(4): 1057-1065.
12.
Kim
Kyung Whan, Yeong Kim, Hyun Yeal Seo. 2002. “An evaluation of pedestrian
countdown signals”. KSCE Journal of
Civil Engineering 6(4): 533-537.
13.
Lum
K.M., Harun Halim. 2006. “A
before-and-after study on green signal countdown device installation”. Transportation Research Part F: Traffic
Psychology and Behaviour 9(1): 29-41.
14.
Ma
Wanjing, Dabin Liao, Yu Bai. 2015. “Empirical analysis of countdown signals on
pedestrian behaviour”. Proceedings
of the Institution of Civil Engineers-Transport 168(1).
15.
Rozporządzenie Ministra Transportu i Gospodarki Morskiej z
dnia 2 marca 1999 w sprawie warunków technicznych jakim powinny
odpowiadać drogi publiczne i ich usytuowanie. Dziennik Ustaw z dnia 17 lutego 2015, poz. 329 (2015).
[In Polish: “The Ordinance of the Minister of Transport and Maritime
Economy of 2 March 1999 regarding technical conditions which should be met by
public roads and their location”. Journal
of Laws 17 February 2015: item 329.]
16.
Jacyna,
Marianna. 2008. Wybrane zagadnienia
modelowania systemów transportowych. [In Polish: Selected
Issues in Modelling Transport Systems.] Warsaw: Warsaw University of
Technology Publisher.
17.
Steenbrink
Peter, Wojciech Michałowski. 1978. Optymalizacja sieci transportowych. [In Polish: Optimization
of Transport Networks.] Warsaw: WKiŁ.
18.
Krawiec S. et al. 2015. Warunki
techniczne infrastruktury drogowej stosowanych w organizacji ruchu na
drogach. Tom I Prawne, społeczno-ekonomiczne i techniczne uwarunkowania
poprawy bezpieczeństwa i warunków ruchu drogowego w odniesieniu do
znaków i sygnałów drogowych oraz urządzeń
bezpieczeństwa ruchu drogowego stosowanych w organizacji ruchu na drogach,
Część IV Wyniki badań laboratoryjnych i empirycznych w
odniesieniu do proponowanych rozwiązań. [In Polish: Technical
Conditions of Road Infrastructure Used in the Organization of Traffic on Roads.
Volume I. Legal, Socio-economic and Technical Conditions for Improving Safety
and Road Traffic Conditions in Relation to Road Signs and Signals and Road
Safety Devices Used in the Organization of Traffic on Roads. Part IV. Results
of Laboratory and Empirical Tests in Relation to Proposed Solutions.]
Warsaw.
19.
Sierpinski
Grzegorz, Marcin Staniek. 2016. “Education by access to visual
information methodology of moulding behaviour based on international research
project experiences”. In Ninth
Annual International Conference of Education, Research and Innovation (iCERi).
Seville, Spain. 14 November 2016. ICERI
Proceedings: 6724-6729.
20.
Smierzchalski
R., A. Łebkowski. 2003. “Moving objects in the problem of path
planning by evolutionary computation”. In Sixth International Conference on Neural Networks and Soft Computing.
Zakopane, Poland. 11-15 June 2002. Neural
Networks and Soft Computing. Advances in Soft Computing: 382-387
21.
Łebkowski
A. 2018. “Design of an autonomous transport system for coastal
areas”. Transnav-International
Journal on Marine Navigation and Safety of Sea Transportation 12(1):
117-124
Received 12.03.2018; accepted in revised form 11.08.2018
![]()
Scientific
Journal of Silesian University of Technology. Series Transport is licensed
under a Creative Commons Attribution 4.0 International License