Article citation information:
Mindur, M. Methodology for examining the links
between transport and the economy. Scientific
Journal of Silesian University of Technology. Series Transport. 2017, 96, 129-137. ISSN: 0209-3324. DOI: https://doi.org/10.20858/sjsutst.2017.96.12.
Maciej MINDUR[1]
METHODOLOGY FOR EXAMINING THE
LINKS BETWEEN TRANSPORT AND THE ECONOMY
Summary.
This paper discusses the findings of studies on the relationship between the
world economy and transport, based on the polynomial curve in 1995-2015. The
socio-economic measures were reviewed, recognizing that GDP, although not
reflecting what is happening in the social sphere, is the best indicator of
economic growth, especially its dynamics. The results of the review show a high
convergence in the shaping of the polynomial curves representing GDP and total
transport, which is confirmed by the closeness of this relationship, as well
the relationship between economic development and transport. The coefficients
R2 of the variables studied are fully reliable, ranging from 0.9725 to 0.9954.
Keywords:
economy; transportation; socio-economic measures
1. INTRODUCTION
This paper analyses the development
of the world economy and its relationship to transport, which has secured its
needs in the period 1995-2015. The needs of the economy resulting from its
functioning and development determine the size and form of transport. The
importance of transport (its functions and links with other sectors of the
economy) to the development of the economy, as well as the interrelationships
and interdependencies between the economy and transport, is also examined.
The study considers the economies of
the most developed countries, which have been the largest economies for
decades, the world’s largest GDP, and the trends in the contemporary world,
namely, the US, Japan and the EU-28. There are also two countries with enormous
potential, the largest area, significant natural and military resources, which
have been rapidly developing in recent years, namely, Russia and China (the
world’s most populous country, developing continuously for more than 30 years,
according to some reports, contributing more to global GDP than Japan).
The paper also considers Poland,
whose economy (in terms of size) cannot be compared with any of the economies
of the countries in question. Therefore, the analysis of the economic situation
was not compared in terms of macroeconomic size, but to the development of
economic processes. The study uses polynomial curves.
2. GDP: THE PRIMARY MEASURE OF ECONOMIC
RESEARCH
Analysts comparing the
socio-economic situation have, at their disposal, many measures of economic
development. The most prevalent of these is GDP, a measure of production
generated by manufacturing factors located in the territory of a country,
regardless of who owns it [1.]
The GDP of a given country
determines its share in global GDP. This measure does not take into account the
potential of individual countries; it would be difficult to assume that the
share of the US, a resource-rich country with 300 million inhabitants, would be
the same as the 500,000 inhabitants of Luxembourg (which equates to the area of
a Polish voivodeship).
Against this background, GDP per
capita is used more frequently, whereby
the GDP of the country is divided by the number of inhabitants (in the
example of GDP per capita in Luxembourg, it is USD 70,000, while, in the US, it
is USD 45,000).
The GDP measure, although commonly
used, is often criticized. First of all, it emphasizes that it is a determinant
of economic growth (especially its dynamics, i.e., the percentage growth of GDP
against the previous year), but it does not reflect what is happening in the
social sphere (mainly regarding the issue of GDP redistribution). Nevertheless,
it is often a component of other aggregates, as is the case with the Human
Development Index (HDI).
3. OTHER MEASURES FOR TESTING SOCIAL AND
ECONOMIC DEVELOPMENT
In 1990, while looking for a measure
that would be more reliable than GDP in reflecting the social situation, the
Pakistani economist Mahbud ub Haqa created a new (previously mentioned)
aggregate, the HDI. This unit of measurement consists of three elements (two of
which are related to the social sphere, with the third intended to reflect the
socio-economic situation):
-
Education,
i.e., the ratio of enrolment
-
Health,
which is measured by life expectancy
-
Development,
which is expressed in GDP per capita according to purchasing power parity
The state of health measured by the
average citizen’s lifespan is, however, a measure to be discussed. Life
expectancy depends not only on the availability and quality of medical services
in a given country, but also on cultural values and climatic conditions; e.g.,
a long-term lack of sunshine behind the polar circle increases levels of
depression (especially among Europeans), which frequently (e.g., in Sweden)
lead to an increase in the number of suicides.
Another factor that affects health
and longevity is diet. It is well known that, for example, rich in meat and
fats, the Inuit diet is unhealthy and does not contribute to prolonging one’s
life, as opposed to the Mediterranean diet, which is considered to be much
healthier, reducing the risk of cardiovascular disease.
Cultural habits, such as the
tendency of Nordic nations to participate in active forms of spending time
together and participating in sport, are also influenced by life expectancy, in
contrast to, for example, the US (especially Texas), whose citizens are fond of
‘gluttony’ and are known for disliking physical activities. It is difficult to
assume that US medicine is at a lower level than in Sweden (although, in the
latter country, it is more accessible to the majority of the population). This
does not change the fact that life expectancy is the result of cultural habits,
systems of values and climate, as well as the level of medical support in a
given country.
For the past few years, Norway has
been leading the HDI rankings, followed by Iceland, Switzerland, Canada,
Australia, Sweden, the Netherlands, Japan, France and, increasingly, Ireland.
Poor countries, such as Mali, Sierra Leone, Afghanistan and Niger, are in the
lowest positions.
The HDI is a measure used by
analysts working for the UN, along with the Human Poverty Index (HPI). The HPI
is divided into two types of measurement: HPI I and HPI II.
HPI I consists of the following:
-
Probability
of death before the age of 40
-
Degree
of illiteracy
-
No
access to running water
-
Children
being underweight
HPI II takes into account the
following:
-
Probability
of death before the age of 60
-
Long-term
unemployment
-
Degree
of illiteracy
-
Percentage
of the population with an income below 50% of the average income
Sweden, Norway, the Netherlands,
Finland, Denmark, Germany, Switzerland, Canada, Luxembourg and Austria are
among the countries with the lowest poverty levels.
Economic politicians, while
analysing social issues, focus primarily on income ranges. Their analysis
methods include a decile method, i.e., comparing 10% of the worst- and
best-located societies, or the quintal method, which compares the 25% best and
worst earners. Another way to investigate income scales is to use the so-called
Gini factor.
In recent times, various measures
have been popularized, which were not previously known in the theory of
economics, and are now more and more common in academic discussion forums.
These include the Index of Economic Freedom, where countries are classified
into one of four groups, on a scale of 1 to 5:
-
In
the first, from 1 to 1.9, there are those whose economies are considered free
(it is interesting to note that this group includes both countries whose
economies have long been considered liberal, e.g., the US, the UK or Hong Kong
, countries such as Denmark and Sweden, which have, for decades, been promoting
a model of a caring state with a large share of the public sector).
-
In
the second group, from 2 to 2.9, there are countries with “rather free”
economies (Poland is included in this group).
-
The
third group comprises countries between 3 and 3.9, whose economies are viewed
as “less liberal” rather than “free” (China and Russia are included here, among
others).
-
The
fourth group, from 4 to 5, comprises countries whose economies are considered
repressed [2].
This indicator is calculated as an
arithmetic mean after analysing several test areas. These are:
-
Trade
-
Tax
arrangements
-
The
extent of government intervention in the economy
-
The
monetary system
-
The
capital flow and foreign investments
-
Finance
and banking
-
Entrepreneurship
-
Property
rights
-
Honesty,
transparency and corruption
-
Labour
market
All the above-mentioned areas of
activity are analysed and evaluated. However, this factor raises much emotion.
First of all, great controversy is prompted when making comparisons between
countries that fall into each of the groups. For example, how it is possible to
explain the location of Italy in 67th place, between Uganda and Nicaragua, and
behind Oman, Belize and Kuwait, while the classification of France’s economic
freedoms are on a par with Jamaica? Meanwhile, why is Poland in 94th place,
between Senegal and Saudi Arabia, and Pakistan and the Cape Verde Islands? What
reasonable rationale is behind the placement of China and Russia in places 126
and 127, respectively, after Lesotho and Yemen, and Ukraine after Niger? Or the
classification of Vietnam, which has enjoyed rapid economic development in the
last 30 years, being on a par with the Central African Republic, which is
characterized by the stagnation? What about Iran, which is eighth from the end
[3]?
Secondly, this situation is also
questionable given that these analyses and evaluations are carried out by the
Heritage Foundation, an organization that declares independence, despite being
sponsored by the US government [3].
Thirdly, this factor assumes that
“economic freedom” is an optimal economic model, which is not shared by all
economists. This system is also denied by some governments, especially by those
from Asian countries, who rely on planned development. While comparing the
dynamics of GDP in countries with different models of economic development, one
can observe that liberalization does not always lead to rapid economic growth.
There is another measure, which,
although not “researching” the economy in the strict sense of the word, is of
the utmost importance: the indicator of corruption perception. Corruption,
leading to the misallocation of funds or inappropriate planning of investments,
can impede economic growth or limit the inflow of foreign investment.
The definition of the above
indicator consists of examining, on a scale from 1 to 10, the extent to which
states are corrupt. The results are analysed by Transparency International,
which publishes annual reports systematizing states from the least to the most
corrupt. Norway, Denmark, Sweden, Finland, Iceland, New Zealand, the Netherlands
and Luxembourg have led on the list for several years now, but the Democratic
Republic of the Congo, Pakistan, Bolivia and Nigeria close the list. Poland’s
lowering position in this ranking may cause some anxiety, as well as the fact
that, year per year, the distance between Poland and not only the leading
countries but also others from the region is widening.
The perception of consumption
factor, in the same way as the previously described measures, also provokes a
great deal of emotion and is often questioned. The most problematic is the way
of measuring corruption, which is not a phenomenon that can be parameterized.
So, to a large extent, the ranking created by Transparency International is
subjective.
As mentioned earlier, GDP, albeit a
commonly used measure, is also often criticized because it does not reflect
what is happening in the social sphere. Despite this criticism, it is
undoubtedly the best indicator of economic growth (and especially its
dynamics), which is why this indicator is used in this paper.
4. SHAPING OF GDP IN SELECTED COUNTRIES IN
1995-2015
GDP is a measure of production
generated by manufacturing factors located on the territory of a country,
regardless of who owns its.
-
The
GDP of a given country determines its share in global GDP (it does not take
into account the country’s potential)
-
GDP
per capita is more commonly used, i.e., GDP per one person
-
The
GDP measure is a determinant of economic growth (especially its dynamics), but
it does not show what is happening in the social sphere
The analysis of GDP polynomial
curves in the studied countries and the EU-28 (Fig. 1) allows the following
conclusions to be drawn:
-
GDP
has not systematically increased in every country surveyed between 1995 and
2015
-
The
US has the highest GDP throughout the period under consideration.
-
Despite
the fact that GDP growth in the US in the early years has been at an average
level of around 3%, its growth has been much higher in recent years. Despite
its high (at that time) value at the beginning of the analysed period (1995),
the overall size of the increase was very large, which explains why the US
economy was (and is) the largest in the world.
-
The
second largest economy in the world is the EU-28 economy, mainly due to the
strong economies of Germany, France, the UK and Italy (these countries are
among the largest exporters).
-
The
third place in terms of GDP until 2011 was occupied by Japan, whose growth was
(and continues to be) systematic, stable and at a high level.
-
China,
whose rapid GDP growth since 2007 has resulted in its move into third position
in 2012 (ahead of Japan); the country is one of the world’s largest exporters.
-
Russia
and Poland are at the lowest level.
-
Although
the value of GDP for Poland was the lowest, we can observe constant growth until
2015.
The analysed countries produce more
than 70% of global GDP in the world, meaning that their economies have a
decisive influence on directions and trends in world production.
5. THE CARRIAGE OF GOODS IN SELECTED
COUNTRIES
The shape of the polynomial curve
representing the volume of transport work performed in the most developed
countries of the world and in the EU (Fig. 2) shows a relatively close
relationship with their economic development (measured by GDP). The diversified
economic development and the nature of production is reflected in the volume of
freight movements (in ton/km):
-
The
US, as with the size of GDP, is at the highest level in the world. It should be
emphasized that, in general terms, the dominant role played in the period 1995-2015
was by the US railway.
-
Transport
activity in Russia has been very high, due to the high volume of extraction and
export of raw materials (fuel, gas).
-
Between
1995 and 2007, the EU-28 was characterized by steady growth; since 2009,
however, there has been considerable dynamics (it is important to mention here
that road transport is essential).
-
In
Japan, the carriage of goods was stable, but there has been a decline in recent
years.
-
The
polynomial curve showing the traffic in China points to a large increase, as
evidenced by the dynamic development of the Chinese economy.
-
In
Poland, the trend of the polynomial curve is at the same level, which could
mean that the development of modern technologies in production has resulted in
less commitment towards transport.
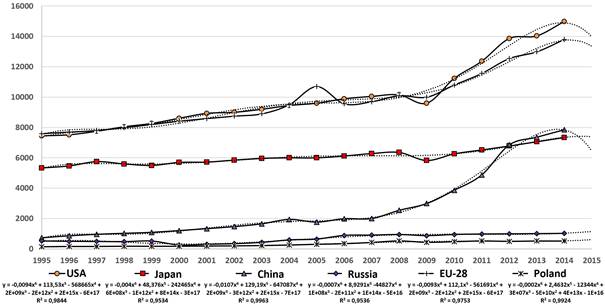
Fig. 1. Shaping of GDP in the selected world
economies (in constant prices in USD)
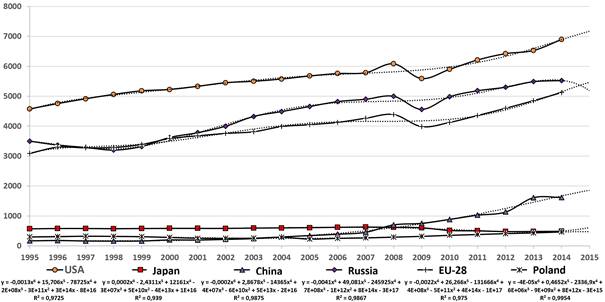
Fig. 2. Shaping of the total
carriages of selected countries (in billion tons/km)
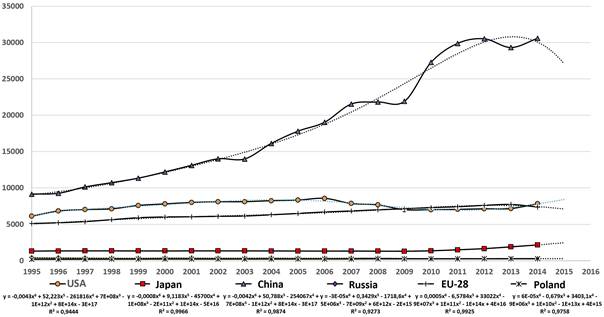
Fig. 3. Shaping of passenger
carriages in total for selected countries (in billion passengers/km)
6. SHAPING OF PASSENGER CARRIAGES (IN BILLION
PASSENGERS/KM) IN SELECTED COUNTRIES BETWEEN 1995 AND 2015
On the basis of studies on the
development of passenger transport, the following conclusions can be drawn:
-
The
most dynamic, and at the highest level, are general passenger services in
China, which indicates a very high growth of the mobility of its society.
-
In
second place in the period being studied, with a slight upward trend, albeit
decreasing in the last few years, was the US (it can be emphasized that
individual transport in the US is the most developed in the world).
-
In
next place, with a stable and steady upward trend, are general passenger
services in the EU (here we also note a high growth of individual transport).
-
In
Japan, passenger services have remained at a constant and very even level,
which may prove that public transport vehicles in this country have the
capacity to satisfy needs in this area.
-
The
development of passenger services in Russia and Poland remains at a steady low
level.
The growth of passenger transport
(Fig. 3) in China and the EU-28 indicates an increase in the mobility of their
societies. The growth of passenger transport makes it possible to move freely,
which offers the possibility of the following [4]:
-
Wide
choice of workplaces
-
Continuing
and completing education at various levels
-
Greater
choice of consumer goods
-
Freedom
of choice regarding place of residence
Mobility, ensuring the free movement
of people and goods, also makes it possible to use them optimally, which is one
of the conditions for economic growth.
In the case of China, such a dynamic
growth of passenger transport was also undoubtedly influenced by the population
level of this country.
The shape of the polynomial curve
representing passenger carriage in Japan in 1995-2015 shows that public
transport in this country has already reached a level corresponding to its
population.
The steady level of passenger
traffic in Russia and Poland shows that both countries provide a stable level
of public transport, while doing little to develop it.
7. SUMMARY
Between 1995 and 2015, dynamic GDP
growth has been observable (from a high baseline) in the US and the EU-28.
Equally dynamic (from a much lower base level) has been the GDP growth in
China. The levelled upward trend (from a fairly high level) over the period
considered can be observed for GDP in Japan. Moderate growth trends (from very
low baseline levels) have been observed for GDP in Russia and Poland (Fig. 1).
The analysis of total cargo
movements for the stated time horizon of selected countries based on the
polynomial curve (Fig. 2) shows significant convergence in their formation in
the US, Russia and the EU-28. In all three cases, with a fairly similar
(average) starting level in 1995-2008, transport shows a clear upward trend.
2009 experienced a decline, but, by 2015, there was dynamic growth. In China,
from a much lower starting level between 1995 and 2005, they are now on a level
playing field, with a clear upward trend
visible from 2005 to 2015. In Poland, transport throughout the analysed period
is running at a low level. In Japan, although at a slightly higher level than
in China and Poland, in a way equalized in terms of transport from 1995 to
2007, before seeing a fall from 2007 to 2015. The high convergence in the
shaping of the polynomial curves representing GDP and total transport merits
attention, given the close connection and dependence between economic
development and transport. The coefficients of compatibility of R2 of the
tested variables are reliable, ranging from 0.9725 to 0.9954.
References
1.
Nasiłowski
Mieczysław. 1996. System Rynkowy,
Podstawy Mikro- i Makroekonomii. [In Polish: Market System,
Fundamentals of Micro- and Macroeconomics.] Warsaw: Key Text.
2.
Kędzior
Zofia, Grażyna Musiał, Henryk Brandenburg, eds. 2006. Ekonomia. Kierunki Badań. [In Polish: Economy. Research Directions.] Katowice: Akademia Ekonomiczna w
Katowicach.
3.
Kołodko Grzegorz.
2008. Wędrujący Świat. [In Polish: Wandering World.] Warsaw: Pruszyński i
S-ka.
4.
Liberadzki
Bogusław, Leszek Mindur. 2007. Uwarunkowania
Rozwoju Systemu Transportowego Polski. [In Polish: Conditions of Development of the Polish Transport System.]
Warszawa-Radom: Wydawnictwo Instytutu Technologii Eksploatacji, Państwowy
Instytut Badawczy.
Received 22.04.2017; accepted in revised form 18.08.2017
![]()
Scientific Journal of Silesian
University of Technology. Series Transport is licensed under a Creative
Commons Attribution 4.0 International License