Article citation information:
Irlik, M. Linear positioning of railway objects.
Scientific Journal of Silesian University
of Technology. Series Transport. 2016, 95,
49-57. ISSN: 0209-3324. DOI: https://doi.org/10.20858/sjsutst.2017.96.5.
Maciej IRLIK[1]
LINEAR POSITIONING OF RAILWAY
OBJECTS
Summary. The
article provides an explanation of the issue related to the linear positioning
of railway objects in the context of preparing site data for automatic train
protection systems, such as the European Rail Traffic Management
System/European Train Control System (ERTMS/ETCS). This paper identifies and
compares current approaches for an object’s position based on a line chainage
for orientation and documentation purposes, as well as the object’s position
based on a track axis for the calculation of real world distances, along with
providing examples of measurement systems and presenting conclusions from test
runs for ERTMS/ETCS Level 2 purposes.
Keywords: railway; ERTMS; ETCS; line mileage;
safety systems; railway signalling; measurement
1. INTRODUCTION
Safety
is one of the essential requirements related to railway systems. To increase
safety on railway lines, different automatic train protection (ATP) and
automatic train operation (ATO) systems are used, depending on the
architecture. These provide drivers with lineside information related to the
authorization to move, enabling them to carry out safe operations in the case
of human failure (ATP) or automated operations on trains (ATO). Today, in the
European railway network, a unified ERTMS/ETCS can be found, which meets the
European ATP standard. The common element found in most safety-related systems
(especially ERMTS/ETCS) is granting authorization to trains to move, using
lineside information and trackside descriptions about the length of
authorization, gradients and other information related to the track. Above all,
it is essential that site data introduced to the specific application of the
system will based on trusted and real data about the trackside.
2. ERTMS/ETCS REQUIRES TRUSTED AND REAL SITE
DATA
In an ERTMS/ETCS system, a radio
block centre (RBC) or balise grants specific trains authorization based on
information from the lineside. For an RBC, this is based on interlocking
information about the locked route or the kind of authorization; for a balise,
this is based on information from a lineside electronic unit encoder about a
signal aspect or the state of relay contacts. A system based on this
information and site data, as specified in an RBC-specific application (Level 2
or 3) or a balise telegram (in Level 1), sends information about the authorized
distance (distance to the end of authority in line with the last relevant
balise group passed by the train). This means that the system is based on routing
from element to element. Additionally, this information contains additional
track descriptions, such as static speed profiles, speed limitations, gradient
profiles or track conditions, axle load speed profiles, and the change in
adhesion factor [7-8].
Based on this information, an
onboard ETCS system, based on its odometry information, can calculate and
supervise the braking curve to the end of authority or speed limitation.
Above all, it is essential that site
data used for preparing specific ERTMS/ETCS applications must be trusted and
based on:
- the real-world length for each track
and route
- the list of passable tracks
- navigability between tracks
3. AXIS: TWO CONCEPTS
3.1. Line axis: traditional approach
Currently, in a railway
transportation system, for orientation and documentation purposes, the railway
object’s (e.g., signals, points) position provide linear position information
represented by a metric value based on a line chainage. The line chainage is a
linear referencing system with a non-normed origin. Mostly, this is based on
the instructions and regulations of the competent railway administration. In
Poland, within the PKP Polskie Linie Kolejowe infrastructure, instruction Id-12
sets out the rules for line mileage and includes a list of all railway lines in
the network. Similar rules are in force with regard to other railway
administrations in the EU [1-4].
The line chainage is based on a line
axis, which is traditionally used for positioning objects on one or more
parallel tracks on the line or at a station. The mileage in this context is not
able to reflect real distances travelled by a train because it cannot assume
different distances on two or more tracks involving curves and connectors
between tracks (see Fig. 1).
Fig. 1. Line chainage vs. real
distance reflecting differences in route length
Moreover, in some cases on the line,
when tracks have different longitudinal or plan profiles, chainage gaps or
chainage overlengths are used (see Fig. 2).
Fig. 2. Chainage gaps in the case of
different plan profiles involving two tracks on one railway line
This approach is appropriate for
driver orientation purposes, e.g., in the case of respective speed limitations.
Information about line mileage is presented to the driver by mileage indicators.
Other important information is also delivered to the driver by trackside
indicators (e.g., about speed limitations, sections with lower pantograph). For
documentation purposes and schematic plans with a track layout, this approach
is sufficient.
3.2. Track axis: system distance
The track axis approach is based on
a model that defines the topology for a network of railway tracks (node-edge
model).
In this model, the node connects two
or more adjacent edges. The node could be a signal, point or other
infrastructure trackside object. Each edge defines its own linear referencing
system used for linear positioning or railway objects related to the edge they
belong to (see Fig. 3).
Fig. 3. Edge position of railway
objects
As the measurement along the edge is
based on the track axis (centre line of a pair of rails), this means that it is
able to reflect the real distance travelled by a train. Based on this, it is
possible to easily calculate the relative distance between neighbouring
objects. For the ETCS, it could be used directly or after the calculation of
the track-based distance for each track or route, which is understood as:
![]() length of each track segment (edge)
length of each track segment (edge)
4. METHODOLOGY OF
MEASUREMENT TRACK AXIS
4.1. Measurement tool and process
For the measurement of the real
distance between a neighbouring object on the track, systems are used, which
can be installed on the locomotive and measure different data from different
sources [5-6], namely:
- tachometer
- GPS/GNSS
- video data from high-resolution
cameras installed on front and back of the locomotive
- accelerometer
Equipment
is installed on the locomotive on a draisine (see Figs. 4 and 5)
Fig. 4. Measurement tool schema
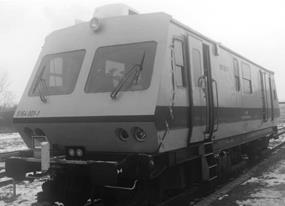
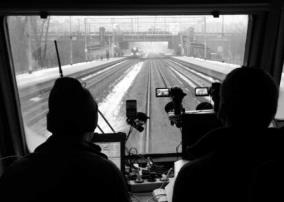
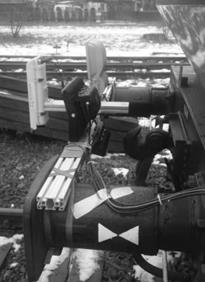
Fig. 5. Equipment installation on an
EM120z draisine during a test run
This kind of system can collect a
wide range of relevant information, such as track-related distances between
infrastructure elements based on two independent sources, gradients, geographic
position, and video data used in data processing.
Data are collected during a run on
the line. Each edge between two nodes (points) must be travelled at least once.
These recorded data are used for
data processing, which consists of three stages, as shown in Fig. 6.
Fig. 6. Data process
Analysed data are treated as the
source. It is also necessary to have track layout plans or topology in place
with a list of measured objects.
Rules defining the requirements of
analysis data for safety critical systems are found in [2-9]. These rules may mean that,
during analysis, two independent persons are required, with analysis of the
video data carried out from two sides (one from the travel direction during the
measurement run and one from the opposite side).
During analysis, the measured and
synchronized data are compared with the track layout plans and the list of
objects being considered (these could be signals, points, balises, track
joints, axle counters, indicators etc.). Additionally, when balises for the
ERTMS/ETCS system are installed, it is possible to synchronize video data about
the real position of balises with information recorded on the onboard Juridical
Recorder for the ETCS concerning the content of particular balise (ID) in order
to assess the installation and programming of particular balises.
The output report from the analysis contains at
least a table with specific data, as shown in Table 1.
Tab. 1
Element list
|
Content |
Description |
|
Basic structure |
Track topology |
|
Elements |
E.g., switch, signal, train detection (axle
counter, isolating joint), platform (begin/end), indicator |
|
Attributes |
|
|
Measurement data |
|
Data can be provided in Excel format
(see Fig. 7) or in one of the XML formats (e.g., RailML format) for further
action.
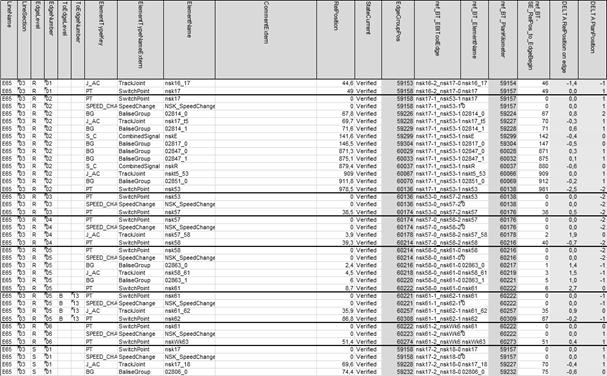
Fig. 7. Example of an element list
format
Processing is divided into two
stages: measurement and validation
The
measurement stage is mostly dedicated to the existing line and without good
quality documentation (line book) for collecting the necessary data for design
purposes. It can be skipped when the line is new and the geodesists’
documentation is of good quality.
The
validation stage is the final verification step after the installation of the
trackside equipment (such as balises). In this stage, data from the design
documentation are compared while being measured, with any deviations analysed.
These measured data can be directly used in the specific application of a
system (e.g., as an input in an electronic XML format).
5. SUMMARY
The author
participated in the test run, as described in Chapter 4, involving the
measurement tool and the review of the reports following analysis. The test was
carried out in January 2017 in the Nasielsk area on the E65 line between the
Warszawa Praga Towarowa and Świercze stations.
Due to the
existing installation of balises and current design documentation for
ERTMS/ETCS Level 2 purposes, the test was based on the validation stage and
carried out with an EM120z draisine, equipped with an onboard ERTMS/ETCS.
Measurement
of this particular area was carried out over three days.
The
collected data were related to distances, gradients and the validation of the
balise telegram. During the test run, some intentional bugs were inserted
during the balises’ installation in order to check whether the tool and the
process were able to find them; this part of test was executed with a positive
result.
Deviations
between plans and measured data mainly occurred if one edge on two parallel
tracks involved a curve. Depending on the curve, the difference was about 10-20
m in distance between the objects located on two tracks.
The above
results allow us to conclude that, for specific purposes such as collecting
site data for an ERTMS/ETCS Level 2 system, track axis data ensure that we have
data that are relevant to the real distance travelled by the train in question.
References
1.
UNISIG-SUBSET-026
version 2.3.0. 2008. Available at: http://www.era.europa.eu.
2.
PN-EN 50126:2002. Zastosowania Kolejowe: Specyfikacja Niezawodności,
Dostępności, Podatności Utrzymaniowej i Bezpieczeństwa. Warszawa: Polski Komitet Normalizacyjny. [In Polish: PN-EN 50126-1:1999. Railway Applications: The Specification and Demonstration of
Reliability, Availability, Maintainability and Safety. Warsaw: Polish
Committee of Standardization.]
3.
PN-EN 50128:2011. Zastosowania Kolejowe: Systemy Łączności,
Przetwarzania Danych i Sterowania Ruchem – Oprogramowanie Kolejowych
Systemów Sterowania i Zabezpieczenia. Warszawa: Polski Komitet Normalizacyjny. [In Polish: PN-EN 50128:2011. Railway Applications: Communication, Signalling and Processing Systems
– Software for Railway Control and Protection Systems. Warsaw: Polish
Committee of Standardization.]
4.
PN-EN 50129:2007. Zastosowania kolejowe: Systemy Łączności,
Przetwarzania Danych i Sterowania Ruchem – Elektroniczne Systemy
Sterowania Ruchem Związane z Bezpieczeństwem. Warszawa: Polski Komitet Normalizacyjny. [In Polish: PN-EN 50129:2003. Railway Applications: Communication, Signalling and Processing Systems
– Safety-related Electronic Systems for Signalling. Warsaw: Polish
Committee of Standardization.]
5.
Oz MA,
Kaymakcı OT, Koyun A. 2017. “A safety related perspective for the power
supply systems in railway industry.” Eksploatacja
i Niezawodnosc – Maintenance and Reliability 19(1): 114-120. DOI:
http://dx.doi.org/10.17531/ein.2017.1.16.
6.
Wang Y., L. Bi, S.
Wang, S. Lin, W. Xiang. 2017. “The application of dynamic Bayesian network to
reliability assessment of EMU traction system.” Eksploatacja i Niezawodnosc – Maintenance and Reliability 19(3):
349-357. DOI: http://dx.doi.org/10.17531/ein.2017.3.5.
7.
Hans W. Ittmann.
2017. “Private-public partnerships: a mechanism for freight transport
infrastructure delivery?” Journal of
Transport and Supply Chain Management 11: 1-13.
DOI: http://dx.doi.org/10.4102/jtscm.v11i0.262. ISSN: 2310-8789.
8.
Fanny Saruchera.
2017. “Rail freight transportation concerns of developing economies:
a Namibian perspective.” Journal of
Transport and Supply Chain Management 11: 1-9. DOI:
http://dx.doi.org/10.4102/jtscm.v11i0.288. ISSN: 2310-8789.
9.
Vivek Singhal, Sukhvir Singh Jain. “Road driver behaviour evaluation
at unmanned railway level crossings.” 2017. European
Transport/Transporti Europei 65: 1-25. ISSN: 1825-3997.
Received 09.06.2017; accepted in revised form 27.08.2017
![]()
Scientific Journal of
Silesian University of Technology. Series Transport is licensed under a Creative
Commons Attribution 4.0 International License